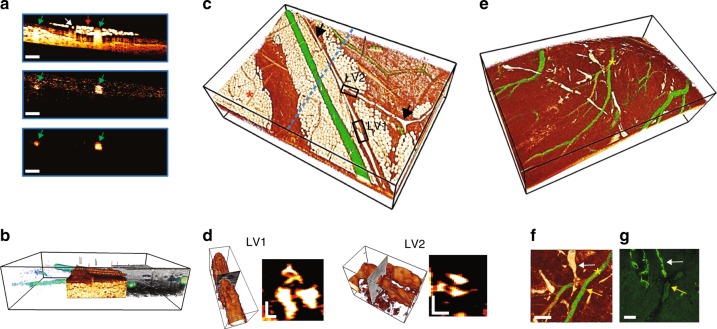
Fig. 4. Vessel imaging of blood and lymphatic vessels of a sacrificed mouse.
Anterior abdominal wall (a-d). Heart surface (e-g). a B-scan comparison of inverse 557 nm, SC-OCTA, and depth-integrated SC-OCTA showing how blood is only highlighted using spectral contrast. Blood vessels (green arrow), lymphatic vessel (white arrow), and adipocytes (red arrow). Scale bar: 250 µm. b Side view peel-away showing depth-integrated SC-OCTA, which allowed blood vessels to be visualized (green), inverse 557 nm with vessels removed showing adipose/lymphatic tissue (White/Orange) and full-spectrum 505–695 nm OCT intensity showing highly scattering tissue (gray). Bounding box: 2.52 × 3.78 × 0.7 mm. c Color-coded 3D rendering. Depth-integrated SC-OCTA (green) showing blood vessels and inverse 557 nm (White/Orange) showing adipocytes (red asterisk) and lymphatics (black arrows). The blue dotted line shows the cross-section location of a. Bounding box: 2.52 × 3.78 × 0.7 mm. d 3D rendering and B-scan cross-sections of lymphatic valve 1 (LV1) and lymphatic valve 2 (LV2) from the black boxes in c, showing a tricuspid valvular structure. Bounding box for LV1: 336 × 112 × 105 µm. Bounding box for LV2: 256 × 141 × 130 µm. Scale bars: 30 µm. e Color-coded 3D rendering. Depth-integrated SC-OCTA (green) showing blood vessels and inverse 557 nm (White/Orange) showing lymphatics in white. Bounding box: 2.02 × 3.36 × 1 mm. f Top view of e showing a blood vessel branch (yellow arrow) with lymphatic vessels (white arrow) and g corresponding immunofluorescence microscopy localizing podoplanin to distinguish blood vessels from lymphatic vessels. f, g Scale bars: 50 µm. The yellow asterisk in e corresponds to the yellow asterisk in f

