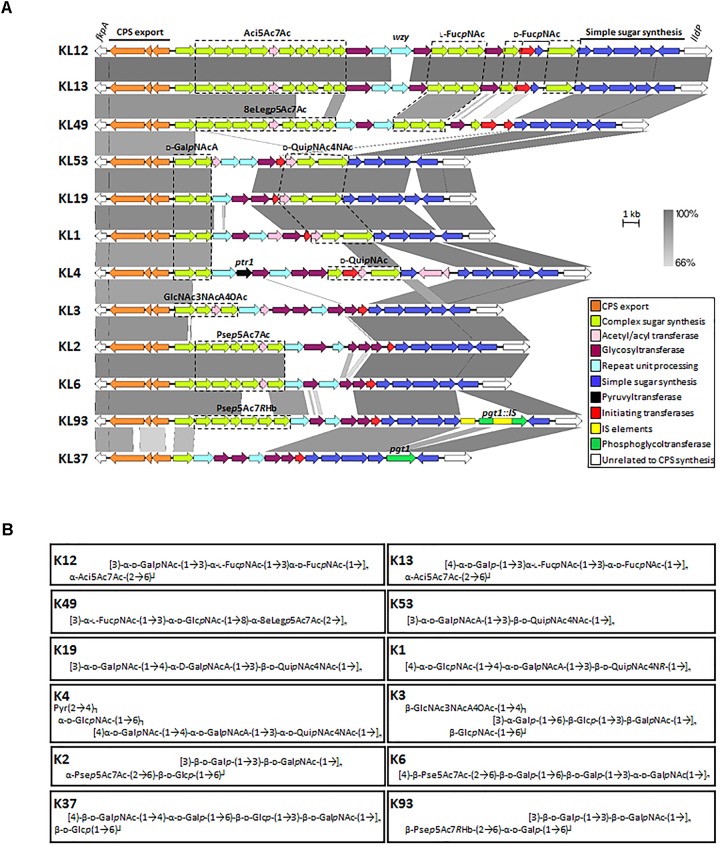
FIGURE 2.
Comparison of representative A. baumannii CPS biosynthesis gene clusters and corresponding structures. (A) Nucleotide sequences representing different KL regions focusing on genes between fkpA and lldP were obtained from the NCBI database and aligned using the Easyfig 2.2.2 tool (Sullivan et al., 2011). Genes are depicted by arrows and indicate direction of transcription whilst IS elements are represented by square boxes. Color scheme is based on homology to the putative function of gene products and are outlined in the key. Nucleotide sequence homology shared between regions is represented by color gradient. Figure is drawn to scale. Gene modules for sugar synthesis of interest are indicated, where Aci5Ac7Ac represents genes involved in the production of 5,7-di-N-acetylacineta- minic acid; L-FucpNAc, N-acetyl-L-fucosaminic acid; D-FucpNAc, N-acetyl-D-fucosaminic acid; 8eLegp5Ac7Ac, 5,7-diacetamido-3,5,7,9- tetradeoxy-L-glycero- D-galacto-non-2-ulopyranosonic (di-N-acetyl-8-epilegionaminic) acid; D-GalpNAcA, N-acetyl-D-galactosaminuronic acid; D-QuipNAc4NAc, 2,4-diacetamido- 2,4,6-trideoxy-D-glucopyranose (N,N’-diacetyl-bacillosamine); D-QuipNAc, N-acetyl-D-quinovosaminic acid; GlcNAc3NAcA4OAc, 2,3-diacetamido-2,3-dideoxy -α-D-glucuronic acid with an additional O-acetyl group; Psep5Ac7Ac, 5,7-diacetamido-3,5,7,9-tetradeoxy-L-glycero-L-manno-non-2-ulosonic (pseudaminic) acid and Psep5Ac7RHb, 5-acetamido-3,5,7,9-tetradeoxy-7-(3-hydroxybutanoylamino)-L-glycero-L-manno-non-2-ulosonic acid. Genes of interest are labeled above corresponding gene, see text for further details. Genbank accession numbers for sequences used in gene alignment are as follows; KL12, JN107991.2 (38.5 kb region; base position range 2332–40832); KL13, MF522810.1 (38.2 kb region); KL49, KT359616.1 (34.5 kb region); KL53, MH190222.1 (23.4 kb region); KL19, KU165787.1 (23.8 kb); KL1, CP001172.1 (24.9 kb; base position range 366401 to 3691388); KL4, JN409449.3 (30.9 kb; base position range 2375 to 33327); KL3, CP012004.1, (25.4 kb; base position range 3762660–3788118); KL2, CP000863.1 (27.1 kb; base position range 77125–104246); KL6, KF130871.1 (25.5 kb); KL93, CP021345.1 30.3 kb (base position range 3338210–3368604) and KL37 KX712115.1 (23.4 kb). (B) Capsule structures corresponding to KL gene regions in (A) are shown. Percentage of O-acetylation of specific glycans from K53, K19, K1 are not represented in structural configurations (Kenyon et al., 2016a; Shashkov et al., 2018).

