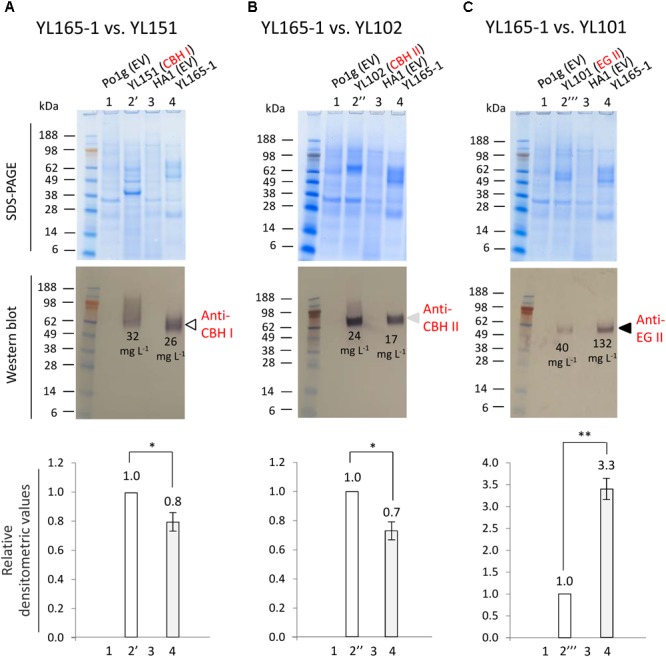
FIGURE 3.

Comparison of cellulase secretion levels between CBH I-CBH II-EG II co-expressing Y. lipolytica transformant YL165-1 and the individual, single cellulase expressing transformants. (A) Supernatant samples for western blot using anti-Tr CBH I antibody. (B) Supernatant samples for western blot using anti-CBH II antibody. (C) Supernatant samples for western blot using anti-EG II antibody. In (A–C), the upper panels show SDS–PAGE gels after staining, and the middle panels show the identically loaded gels used for the western blot, while the bottom panels show the densitometric analysis of the western blots, for which error bars indicate the SEM for three biological replicates; ∗ and ∗∗ indicate significantly different from the reference strains (that expressing single CBH I, CBH II, or EG II) with p < 0.05 and p < 0.01, respectively. Lane 1, strain Po1g (transformed with empty vector) as the parent strain control for YL151, YL102, and YL101. Lane 2′, YL151 expressing chimeric CBH I; lane 2″, YL102 expressing CBH II; lane 2″′, YL101 expressing EG II. Lane 3, strain HA1 (transformed with empty vector). Lane 4, YL165-1. Loading amount was 22.5 μL supernatant per well. Cellulase titers (g L-1) are indicated by numbers in the western blot images.
