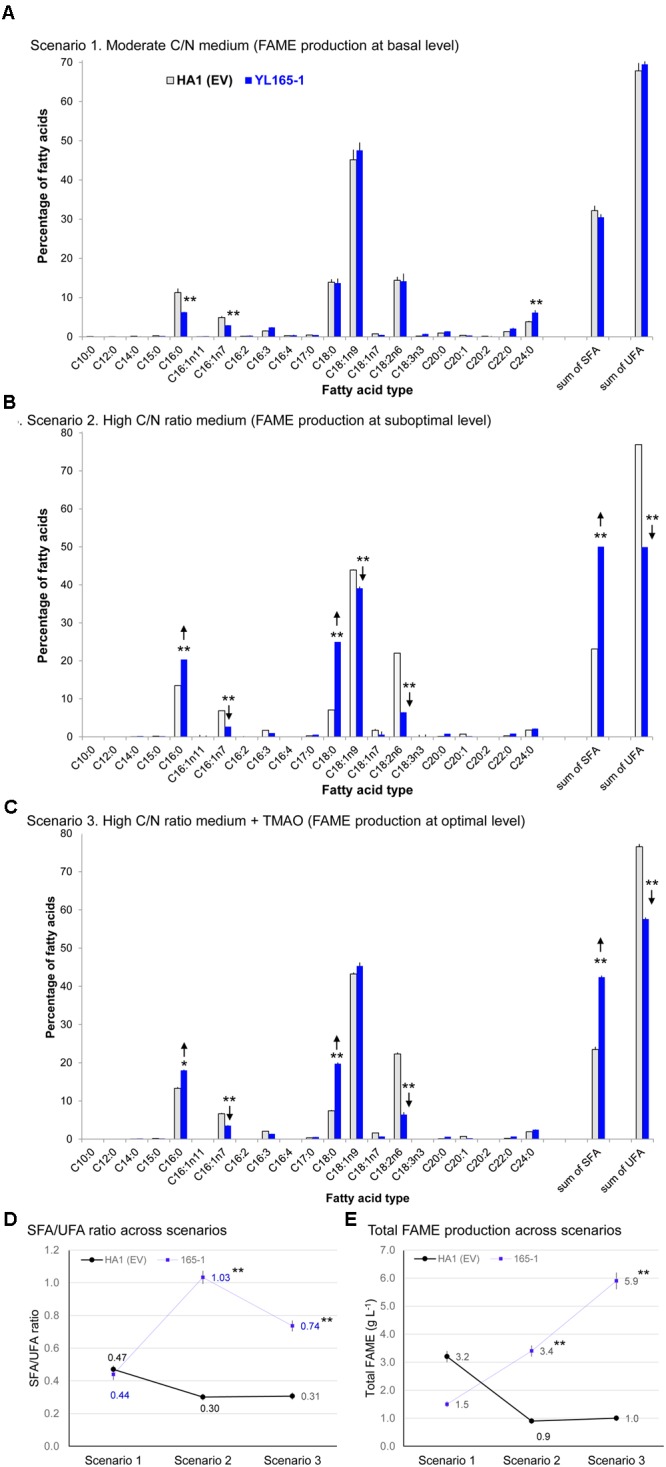
FIGURE 6.

Fatty acid profiles of Y. lipolytica YL165-1 vs. parent control strain HA1 (EV). (A) Cells cultured in YPD-3% glucose medium; (B) cells cultured in high C/N ratio medium; (C) cells cultured in high C/N ratio medium supplemented with the chemical chaperone TMAO. Data presented were the mean of three replicate measurements ± SEM. ∗ and ∗∗ indicate statistical significance of p < 0.05 and p < 0.01, respectively, comparing the same fatty acid type between YL165-1 and parent control strain HA1 (EV) for (A–C), or comparing the SFA/UFA ratio (D) or lipid production (E) of the same cell lines in scenarios 2 or 3 against those in scenario 1. HA1 (EV), parent strain HA1 transformed with empty vector; SFA, saturated fatty acids; SFA/UFA, ratio of saturated fatty acids and unsaturated fatty acids; TMAO, trimethylamine N-oxide dihydride; UFA, unsaturated fatty acids.
