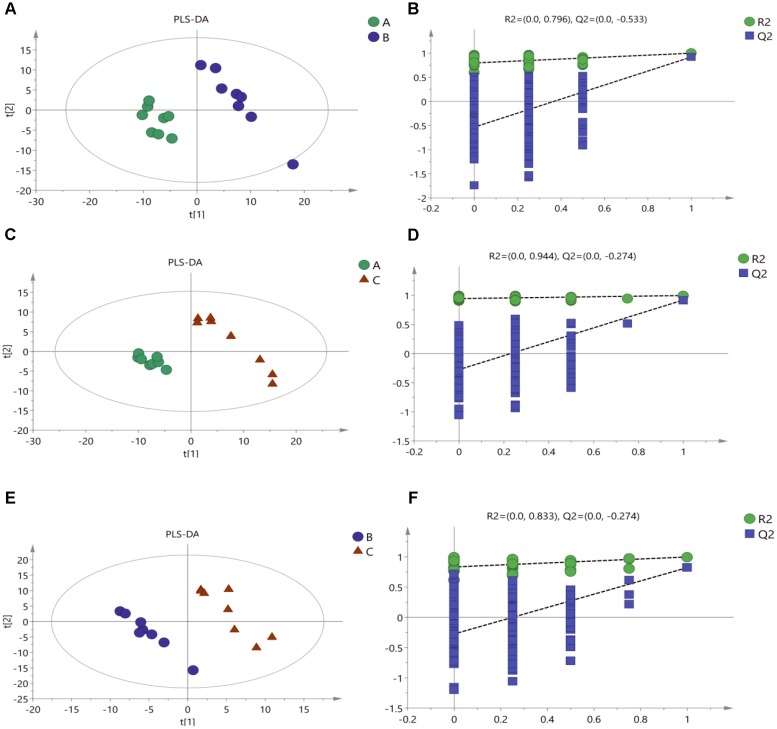
FIGURE 3.
Score plots for extracellular metabolites of GC/MS data. (A) PLS-DA score plots from metabolite profiles for Mycelia A and B samples. (B) A 200 times permutation test of PLS-DA models for (A). (C) PLS-DA score plots from metabolite profiles for Mycelia A and C samples. (D) A 200 times permutation test of PLS-DA models for (C). (E) PLS-DA score plots from metabolite profiles for Mycelia B and C samples. (F) A 200 times permutation test of PLS-DA models for (E).

