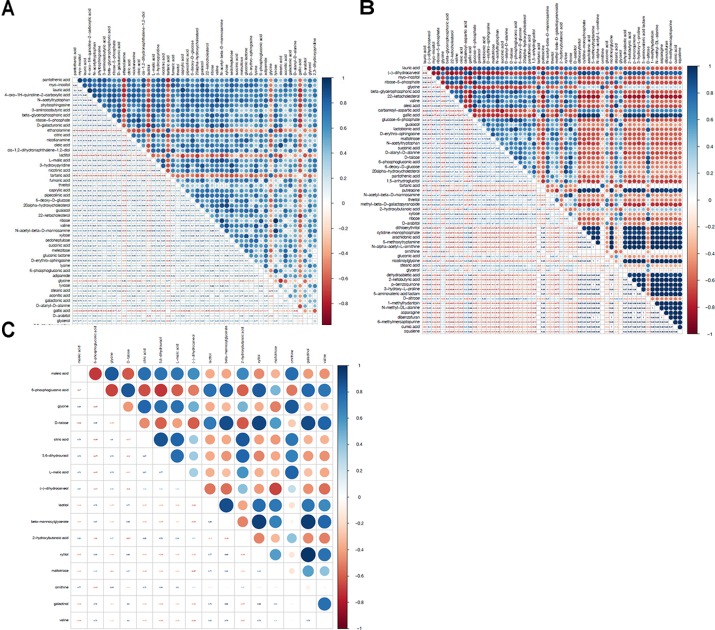
FIGURE 5.
The correlation analysis between differential metabolites in Mycelia B samples and Mycelia A samples (A), Mycelia C samples and Mycelia A samples (B), and Mycelia C samples and Mycelia B samples (C). Blue color represents positive correlation, while red color represents negative correlation (see color scale). The value which is larger demonstrates the greater correlation between the two metabolites.

