
FIGURE 3.
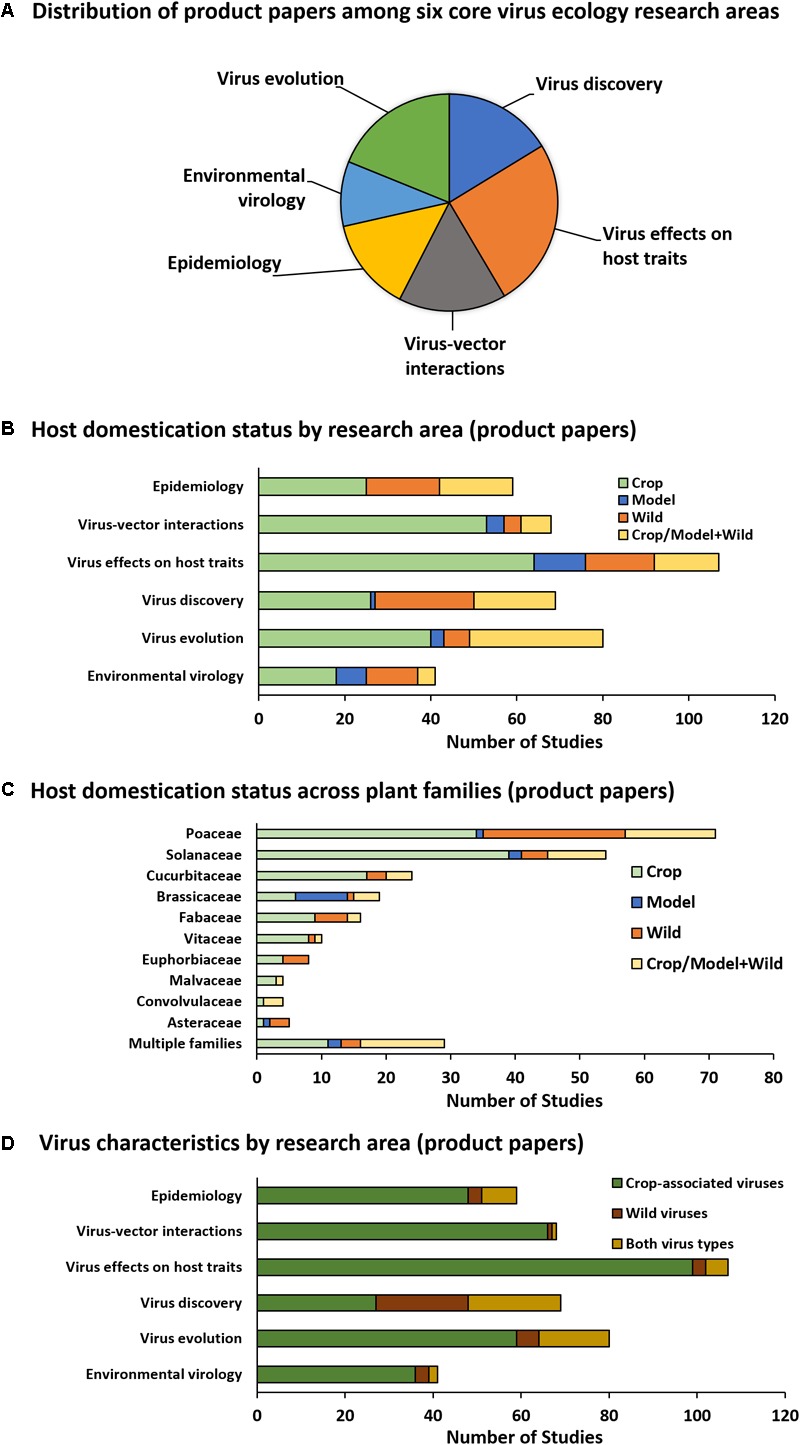
Product paper analysis. The pie graph (A) illustrates the proportion of product papers (those citing direct outputs of PVEN) falling into each core plant virus ecology research area. Graph (B) illustrates the domestication status of hosts studied in product papers organized by research area. Graph (C) illustrates domestication status of hosts studied in product papers organized by plant family and pooled across research areas. Families depicted are those represented by >3 studies. Families not depicted include Actinidiaceae (one study, crop), Amaranthaceae (one study, crop), Amaryllidaceae (two studies, crop/model + wild, one study, wild), Apocynaceae (one study, wild), Orchidaceae (one study, crop/model + wild, one study, wild), Rutaceae (three studies, one each in crop, wild, and crop/model+wild), and Zingiberaceae (one study, crop). Graph (D) illustrates virus characteristics organized by research area.