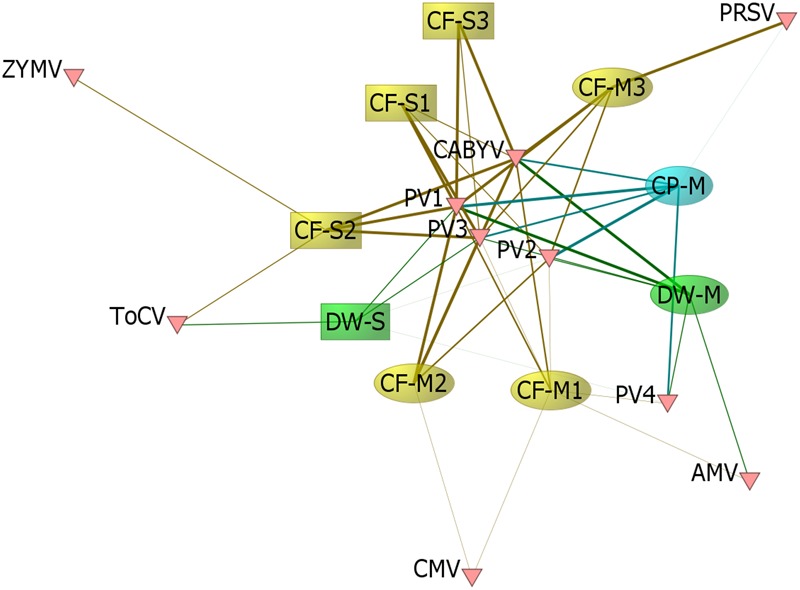
FIGURE 6.

Viral links among hosts. We constructed a matrix of the 9 population groups sampled × 10 viral groups detected, where values for each population within the matrix represented the proportion of individuals sampled in which Illumina sequencing detected the corresponding virus group. We visualized the network structure with the network analysis software ORA-Lite version 11 (Carley et al., 2018), where the network was sized by betweenness centrality. The width of the edge between a given population and virus group represents the proportion of individuals with Illumina-detected infection. Sample codes indicate species (CF, CP, or DW), site of collection (M, Motte Rimrock; S, Shipley-Skinner), and population number within a site (1, 2, and 3).
