
FIGURE 7.
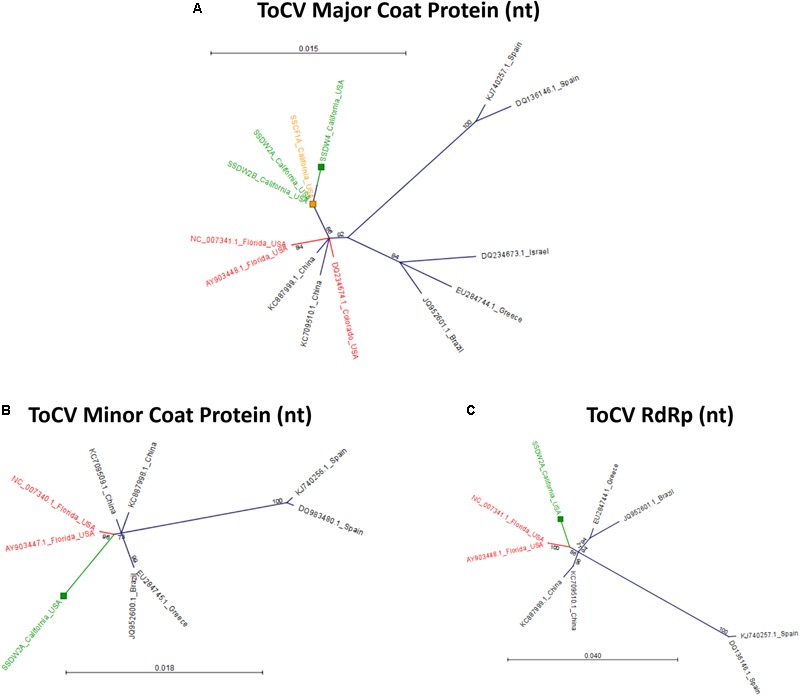
Radial, unrooted trees illustrating results of the maximum likelihood phylogenetic analyses of ToCV nucleotide sequences. For the major coat protein (A), the HKY + T model was used. For the minor coat protein (B), the GTR + G + T model was used. For the RNA-dependent RNA polymerase (C), the HKY + T model was used. Color coding has been applied to aid interpretation of sequence origins (green = D. wrightii, orange = C. foetidissima, red = other sequences from United States isolates). One hundred bootstrap re-samples were performed for each analysis. Branch lengths are measured in the expected number of substitutions per site. Only nodes with bootstrap values ≥70 are shown; nodes with bootstrap values <70 are collapsed and not shown.