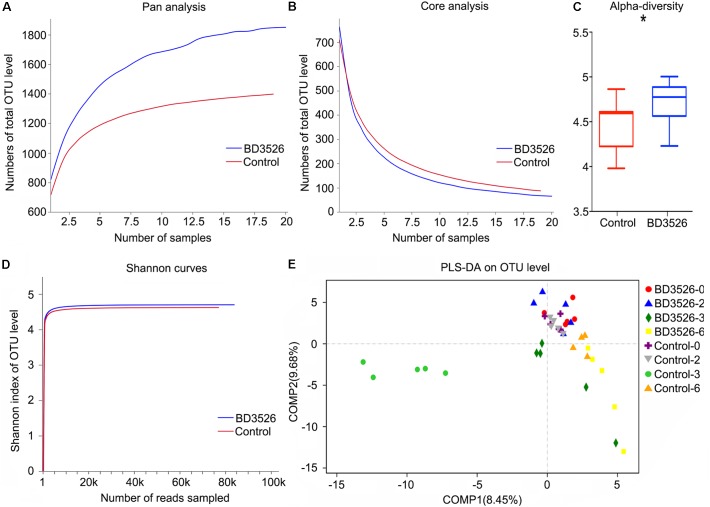
FIGURE 2.
Analysis of the gut microbiota diversity. (A) A pan analysis was used to observing the increase in the total number of species as the number of samples increases. (B) A core analysis was used to observe the decrease in the number of common species as the number of samples increased. (C) The α-diversity statistics show the diversity index values of each sample under each index type. (∗P-value < 0.05, mean ± SEM). (D) The 97% similarity OTU or other taxonomic levels were selected to use mothur software to calculate the diversity index under different random sampling and to use the R-package tools to create the Shannon curve. (E) The PLS-DA algorithm distinguishes sample groups of different time periods in the BD3526 group and the control group.

