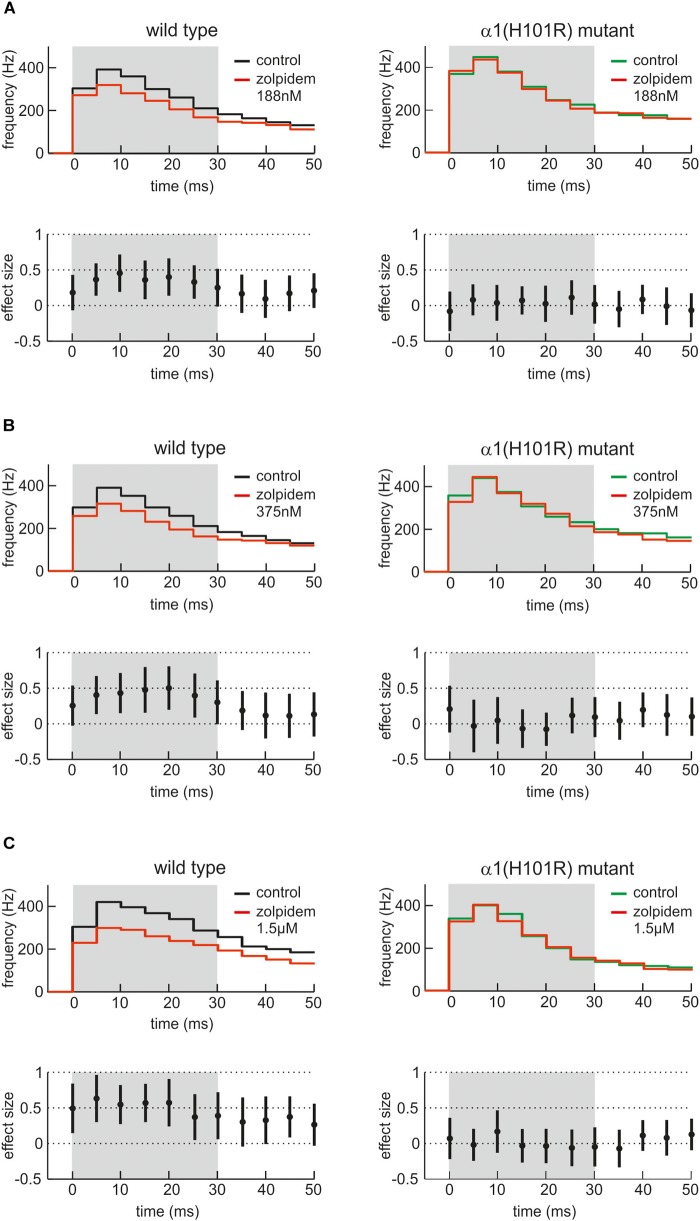
FIGURE 6.
Actions of zolpidem on phases of high neuronal activity. (A–C) The effects of three low concentrations of zolpidem (A: 188 nM; B: 375 nM; C: 1.5 μM, n = 29 – 41, presence of zolpidem indicated in red) are given as PETH with corresponding effect sizes for wild type cultured cortical neurons (left side, black) and neurons from α1(H101R) mutant mice (right side, green). In each case, the upper half of the figure displays the instantaneous action potential firing rate under control condition and in the presence of zolpidem (red). The lower half of the figure shows the corresponding effect size, with a 95% CI not crossing the zero line being equivalent to a statistically significant effect of zolpidem. To reveal the action of zolpidem, PETH and effect size is shown for the first 50 ms after the beginning of averaged neocortical up states. Note that zolpidem induces a depression of neuronal activity between 5 and 30 ms after the beginning of the up state, i.e., when neuronal activity is particularly high. The effect of zolpidem was absent in neurons derived from α1(H101R) mutant mice (right side of the figure), indicating that the action of zolpidem is indeed mediated via α1-containing GABAA receptors.

