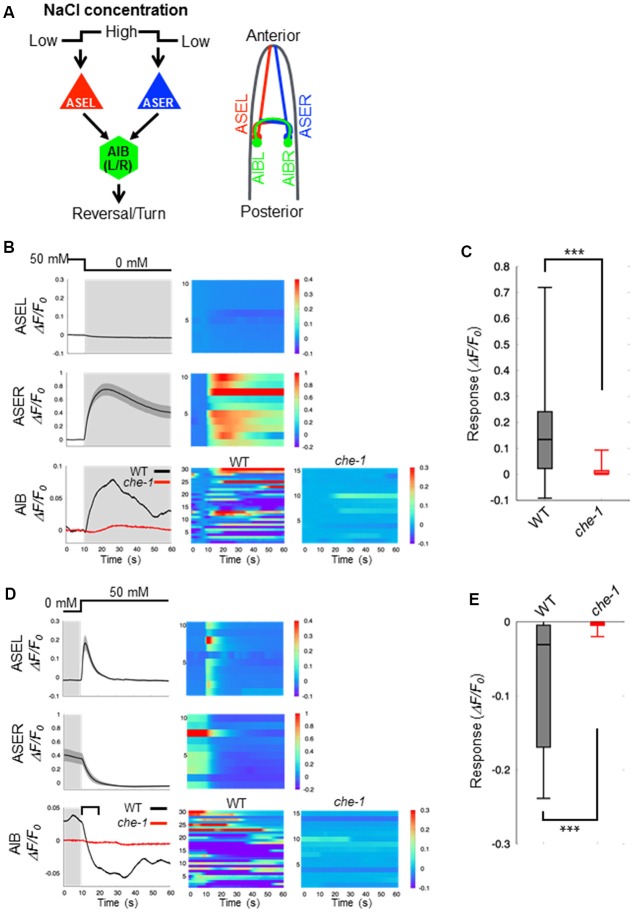
Figure 1.
Calcium dynamics in ASEL, ASER and AIB neurons in response to changes in NaCl concentration. (A) Simplified synaptic connections between ASE sensory neurons (ASEL and ASER) and AIB interneurons. Both ASE neurons respond to changes in NaCl concentration and connect to several interneurons, including AIB. AIB neurons trigger reversal and turning behaviors. (B) Calcium dynamics of ASEL, ASER and AIB neurons in response to a downstep in NaCl concentration from 50 mM to 0 mM. Averaged calcium responses to changes in NaCl concentration (left) and heatmap traces of individual worms (right). The black line indicates the calcium responses in wild-type animals (n = 10), and the red line indicates the calcium responses in che-1(p679) mutants (n ≧ 15). Shaded areas indicate the SEM. (C) Quantitative analysis of the maximum calcium responses in AIB neurons during a downstep in NaCl concentration in the wild type (gray) and che-1 mutants (red). The error bars indicate the SEM; ***p < 0.001; Wilcoxon rank sum test. (D) Calcium dynamics of ASEL, ASER and AIB neurons in response to an upstep in NaCl concentration from 0 mM to 50 mM. Averaged calcium responses to changes in NaCl concentration (left) and heatmap traces of individual worms (right). The black line indicates the calcium responses in the wild-type worms (n = 10), and the red line indicates the calcium responses in che-1(p679) mutants (n ≧ 15). The shaded areas indicate SEM. (E) Quantitative analysis of the maximum calcium responses in AIB neurons during the first 10 s (blanket in D) after an upstep in NaCl concentration in wild type (gray) and che-1(p679) mutants (red). The error bars indicate the SEM; ***p < 0.001; Wilcoxon rank sum test.

