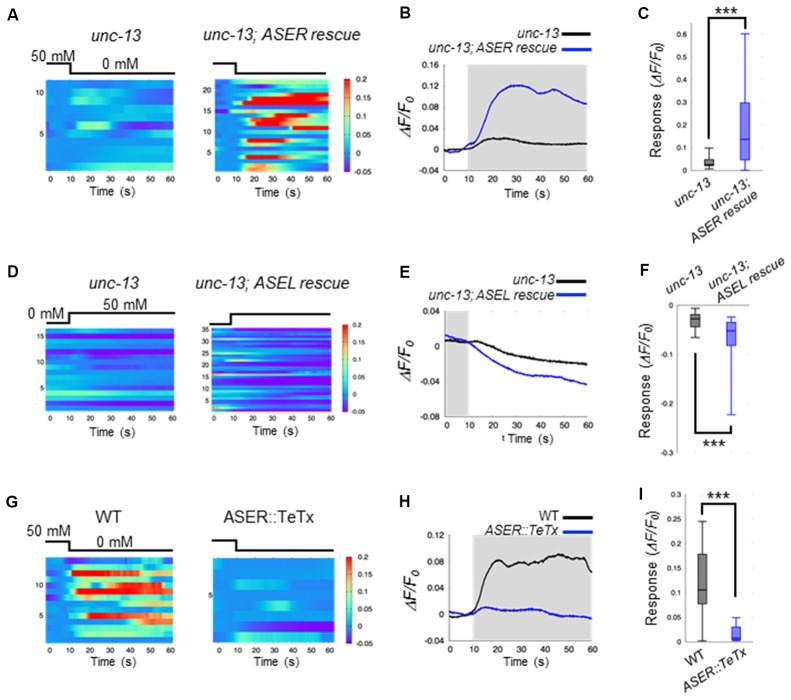
Figure 2.
ASEL inhibits AIB whereas ASER stimulates AIB. (A) Heatmap traces of the AIB response to a downstep in NaCl concentration in unc-13 mutants and ASER-specific UNC-13 rescue worms on a unc-13 mutant background. (B) Averaged calcium responses in (A). The shaded area indicates the period corresponding to 0 mM NaCl. (C) Quantitative analysis of the maximum calcium responses during a downstep in NaCl concentration in (A). The error bars indicate the SEM; ***p < 0.001; Wilcoxon rank sum test. (D) Heatmap traces for AIB responses to an upstep in NaCl concentration in unc-13 mutants and ASEL-specific UNC-13 rescue worms on an unc-13 mutant background. (E) Averaged calcium responses in (B). The shaded area indicates the period corresponding to 0 mM NaCl. (F) Quantitative analysis of the minimum calcium responses in AIBs during the first 10 s after an upstep in NaCl concentration. The error bars indicate the SEM; ***p < 0.001; Wilcoxon rank sum test. (G) Heatmap traces for the AIB responses in wild-type and transgenic worms expressing TeTx specifically in the ASER neuron. (H) Averaged calcium responses in (G). (I) Quantitative analysis of the maximum calcium responses during a downstep in NaCl concentration in (G). The error bars indicate the SEM; ***p < 0.001; Wilcoxon rank sum test.

