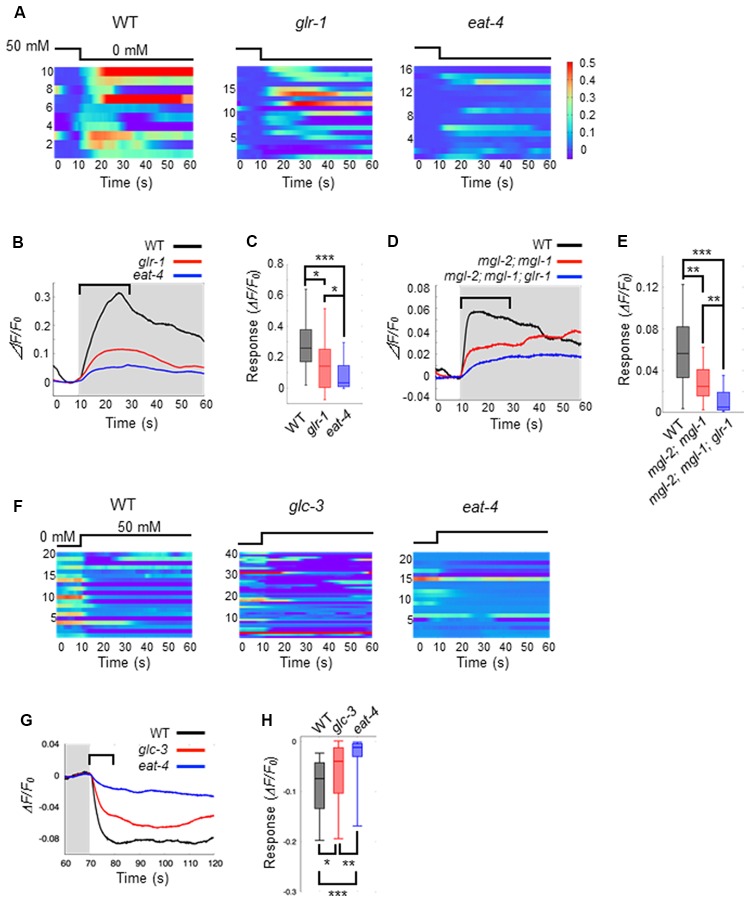
Figure 3.
Glutamate released by ASE neurons and its receptors on AIB neurons elicit AIB excitation and inhibition. (A) Heatmap traces for AIB responses to a downstep in NaCl concentration in wild-type, glr-1(n2461) and eat-4(ky5) mutants. (B) Averaged calcium responses to a downstep in NaCl concentration in (A). The shaded area indicates the period of 0 mM NaCl. A 20 s window used for analysis is shown by a blanket. (C) Quantitative analysis of the maximum calcium responses during 20 s of a downstep in NaCl concentration in (A). The error bars indicate the SEM; *p < 0.05; ***p < 0.001; Wilcoxon rank sum test with Bonferroni correction. (D) Averaged calcium responses to a downstep in NaCl concentration in wild-type (black), mgl-2(tm355); mgl-1(tm1811) double mutants (red) and mgl-2; mgl-1; glr-1 triple mutants (blue) expressing GCaMP6 (n ≧ 18). (E) Quantitative analysis of the maximum calcium responses during 20 s of a downstep in NaCl concentration in (D). The error bars indicate the SEM; **p < 0.01, ***p < 0.001; Wilcoxon rank sum test with Bonferroni correction. (F) Heatmap traces for AIB responses to an upstep in NaCl concentration in wild-type, glc-3(ok321) and eat-4(ky5) mutants. (G) Averaged calcium responses to an upstep in NaCl concentration in (F). The shaded area indicates the period of 0 mM NaCl. A 10 s window used for analysis is shown by a blanket. (H) Quantitative analysis of the minimum calcium responses during the 10 s of an upstep in NaCl concentration (blanket in G). The error bars indicate the SEM; *p < 0.05, **p < 0.01, ***p < 0.001; Wilcoxon rank sum test with Bonferroni correction.

