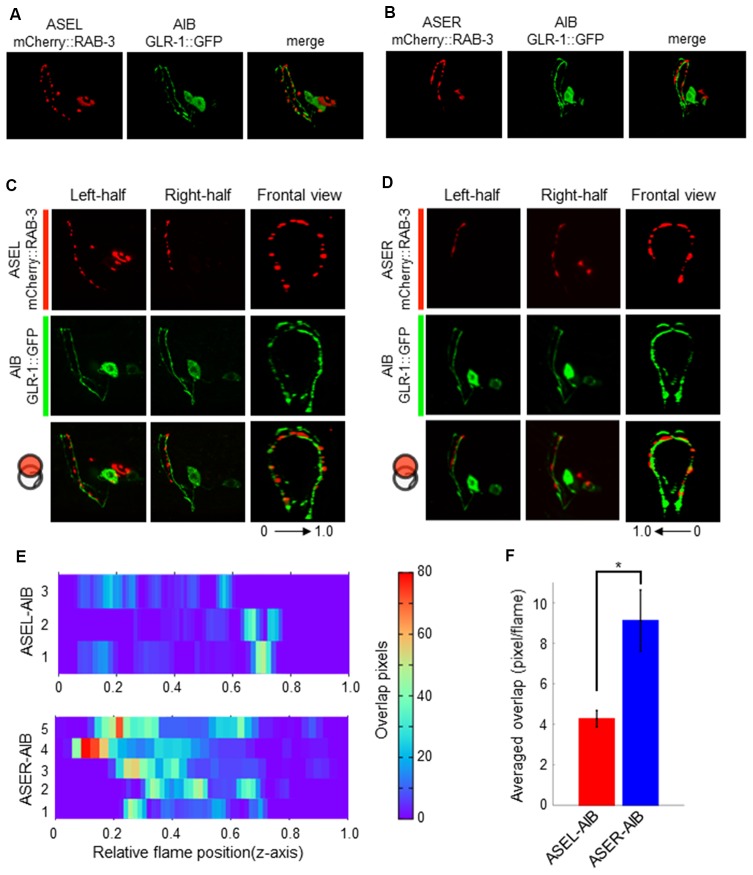
Figure 5.
The localization patterns of the presynaptic protein RAB-3 in ASEL/R neurons and the postsynaptic AMPA-type glutamate receptors in AIB neurons. (A) The localization patterns of RAB-3 in the ASEL and the AMPA-type glutamate receptor GLR-1 in the AIB. (B) The localization patterns of RAB-3 in the ASER and the AMPA-type glutamate receptor GLR-1 in the AIB. (C) One-side images from left or right, and frontal images for the localization patterns of mCherry::RAB-3 on ASEL and GLR-1::GFP on the AIB. The left-half images show the co-localization pattern of mCherry::RAB-3 on the proximal ASEL and GLR-1::GFP in both the AIBL proximal neurite and AIBR distal neurite. The right side shows the co-localization pattern of mCherry::RAB-3 on the distal ASEL and GLR-1::GFP in both the AIBR proximal neurite and AIBL distal neurite. 0–1.0 shows the corresponding Z-axis frame position in (E). (D) One-side images from left or right, and frontal images for the localization patterns of mCherry::RAB-3 on ASER and GLR-1::GFP on AIB. The left-side images show the co-localization pattern of mCherry::RAB-3 on the distal ASEL and GLR-1::GFP in both the AIBL proximal neurite and AIBR distal neurite. The right side shows the co-localization pattern of mCherry::RAB-3 on the proximal ASER and GLR-1::GFP in both the AIBR proximal neurite and AIBL distal neurite. 0–1.0 shows the corresponding Z-axis frame position in (E). (E) Heatmap images of colocalization between mCherry (RAB-3) and GFP (GLR-1). Each colored line represents the overlap between green and red fluorescence in single slice image from Z-stack acquisition of corresponding transgenic worms. Numbers in left indicate individual animals. 0–1.0 is the relative flame position in full Z-stack image. (F) Quantification of overlap position in (E). The number of overlapped pixels in each z-axis frame are averaged. The error bars indicate the SEM; *p < 0.05; Wilcoxon rank sum test.

