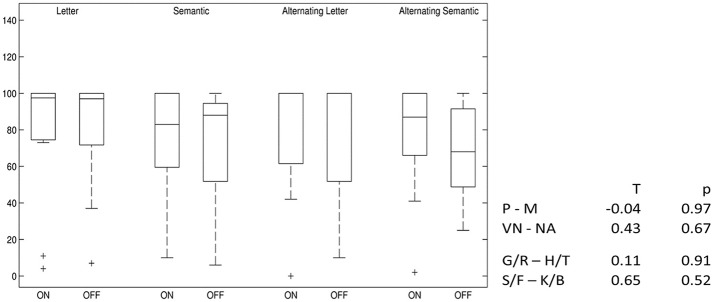
Figure 5.
Differences in verbal fluency: DBS-on vs. DBS-off. Percent ranks of test results, boxplots showing median, upper and lower quartiles. P–M, comparison of phonemic fluency with “P” and “M” letters; VN–NA, comparison of semantic fluency with “Names” and “Food”; G/R–H/T, comparison of phonemic fluency with alternating “G” and “R” and alternating “H” and “T” letters; S/F–K/B, comparison of semantic fluency with alternating “Sport” and “Fruits” and alternating “Clothes” and “Flowers”.

