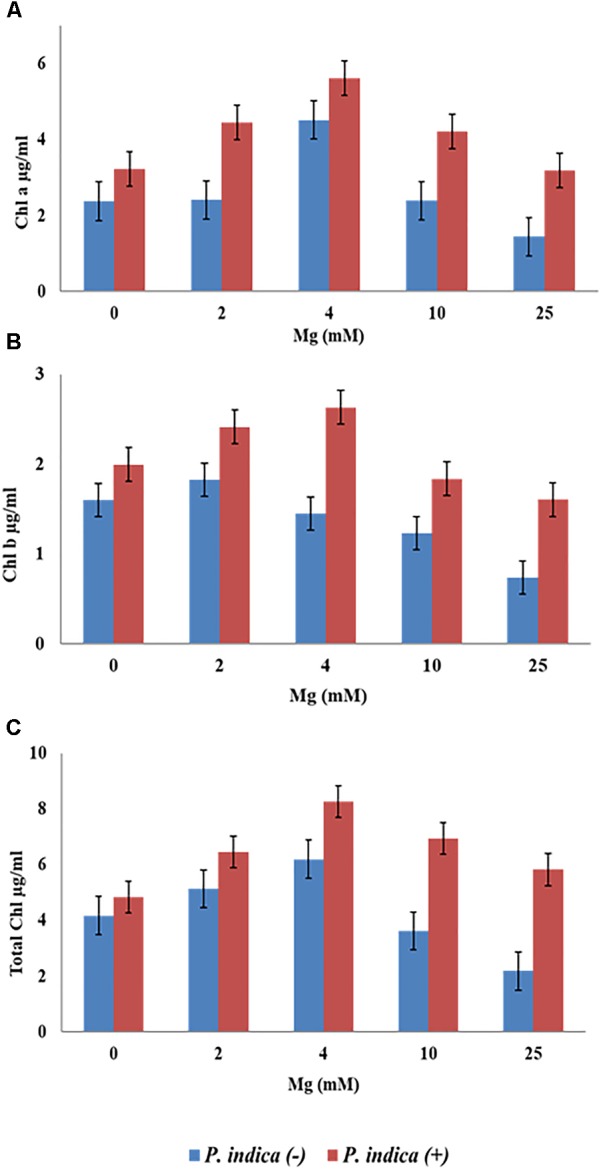
FIGURE 3.

Measurement of chlorophyll contents of the plant during colonization with P. indica and during non-colonized stage. A. thaliana seedlings after 15 days of co-cultivation under different Mg concentration (A) chlorophyll a (B) chlorophyll b (C) total chlorophyll. Each data set represents the means of three independent measurements; all data are found significant at P < 0.05.
