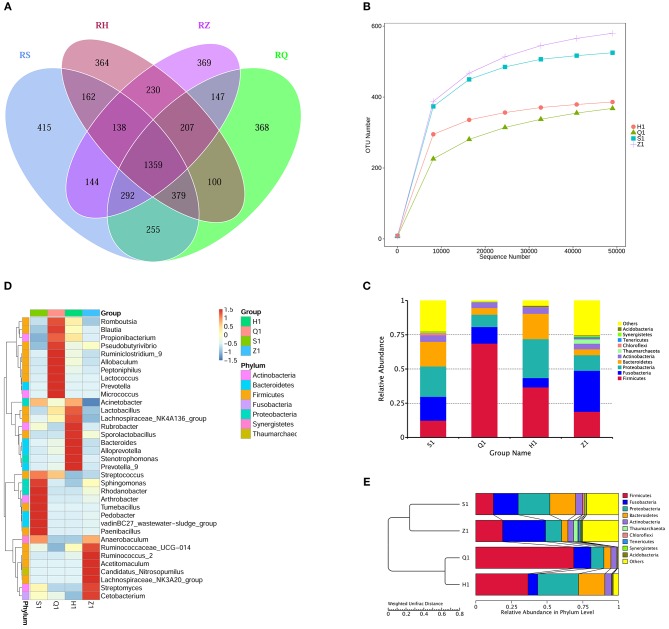
Figure 2.
The intestinal flora in different segments of tilapia were different in structure and diversity. (A) Venn diagram (Petals figure) illustrating the Common or characteristic OTUs in duodenum (S), foregut (Q), midgut (Z), hindgut (H). (B) Rarefaction curves of OTUs illustrating the microbial diversity in duodenum (S), foregut (Q), midgut (Z), hindgut (H). When the curve flattens, it shows that the amount of sequencing data is gradually reasonable, and more data will produce only a small number of new species (OTUs). (C) Column diagram illustrating the relative abundance of Intestinal flora at phylum level in duodenum (S), foregut (Q), midgut (Z), hindgut (H). The horizontal axis is the sample name, and the vertical axis represents the relative abundance of a classification. Different colors correspond to different species at the same level. (D) Heat maps illustrating the relative abundance of Intestinal flora at genus level in duodenum (S), foregut (Q), midgut (Z), hindgut (H). The color and intensity of each square represent the value of relative abundance. (E) UPGMA clustering tree illustrating the similarity between samples of duodenum (S), foregut (Q), midgut (Z), hindgut (H).

