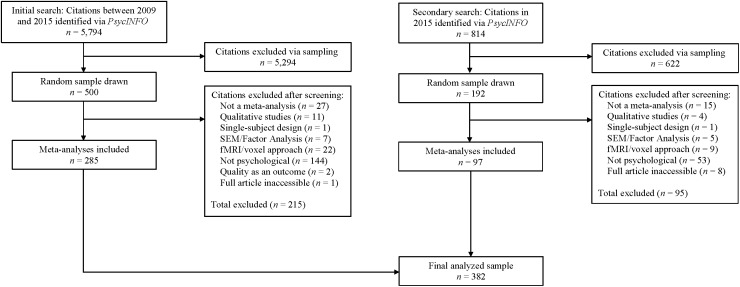
FIGURE 1.
Selection and exclusion of published meta-analyses. Note that the frequencies for “Citations excluded after screening” represent rough estimates for each exclusion criterion. At the time the samples were compiled the frequencies of exclusion for each criterion were not recorded. At the suggestion of a reviewer of this article, we attempted to obtain the frequencies post hoc by coding each excluded article for the criterion we judged most likely to be the reason it was excluded. The coding procedure was completed only by the first author of the present study.

