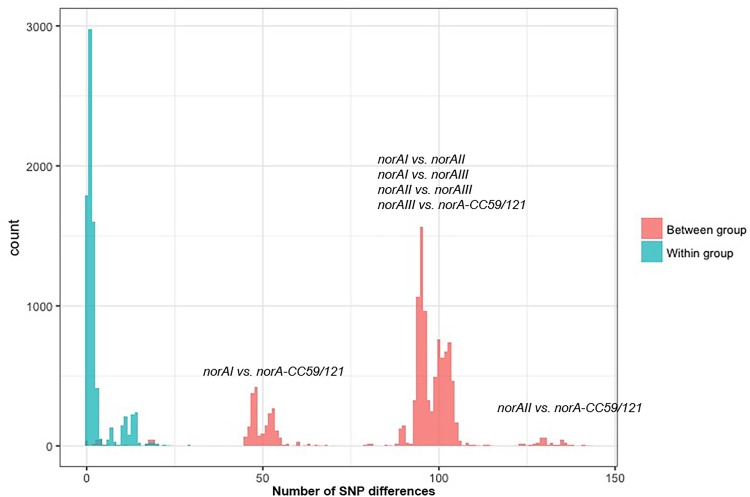
FIGURE 3.
Distribution of the pairwise SNP distance within norA sequences used in this study. The norA sequences include norAI (D90119.1), norAII (AB019536.1) and norAIII (M97169.1), the nine Portuguese isolates, 112 complete assemblies from GenBank, and 75 representative sequences of London isolates. The figure is annotated to show the pairwise SNP distance between isolates both within (blue) and between (red) each of the four major norA groups described in the main text: norAI group, norAII group, norAIII group, and CC121/CC59 group.

