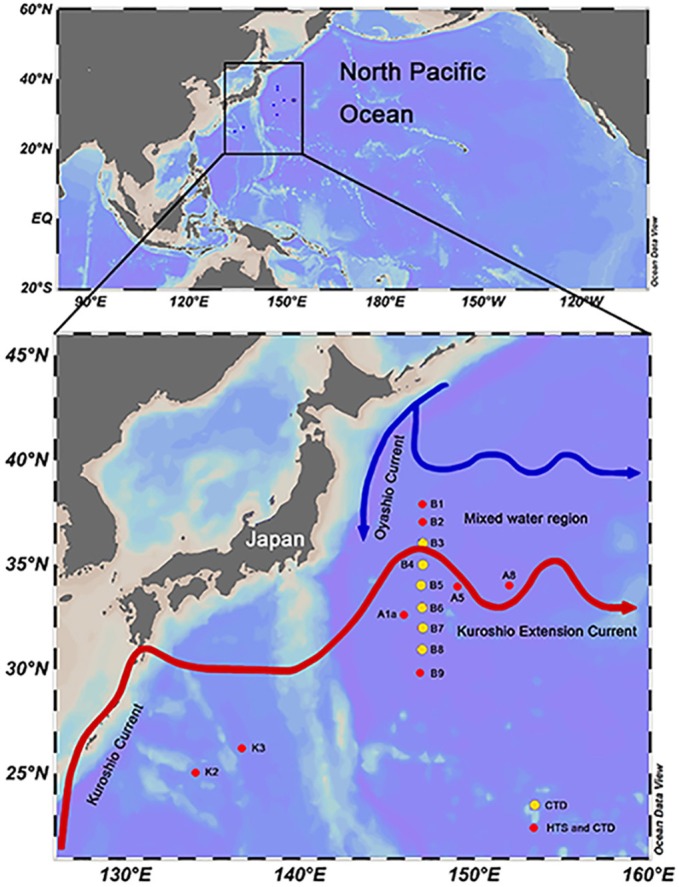
Figure 1.

Sampling sites in the northwestern Pacific Ocean during the spring cruise conducted in 2015. Flow paths of Kuroshio and its Extension Current and the Oyashio Current were modified according to the study of Qiu (2001). The red dots on the map indicate the high-throughput sequencing stations. The yellow dots on the map indicate stations within the B transect for which only physical and chemical parameters were recorded by CTD. The map was produced using the Ocean Data View 4 software.
