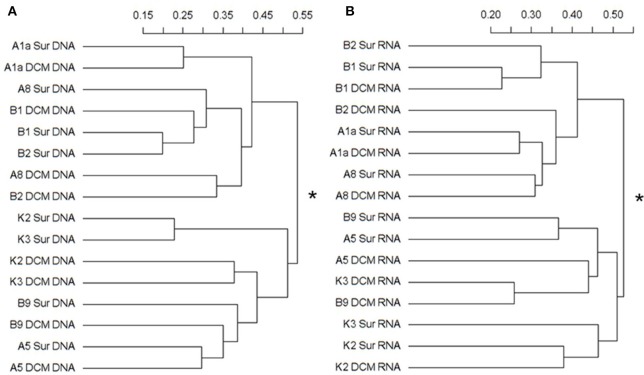
Figure 5.
Cluster diagram of the Bray-Curtis dissimilarities based on the log-transformed relative OTU abundance for each sample. The separated DNA (A) and RNA (B) community groups (with asterisks at the node) exist with significant compositional differences (DNA: r2 = 0.31718, P = 0.001; RNA: r2 = 0.27023, P = 0.001) as determined by PERMANOVA. The percent dissimilarity among samples is shown along the horizontal axes.

