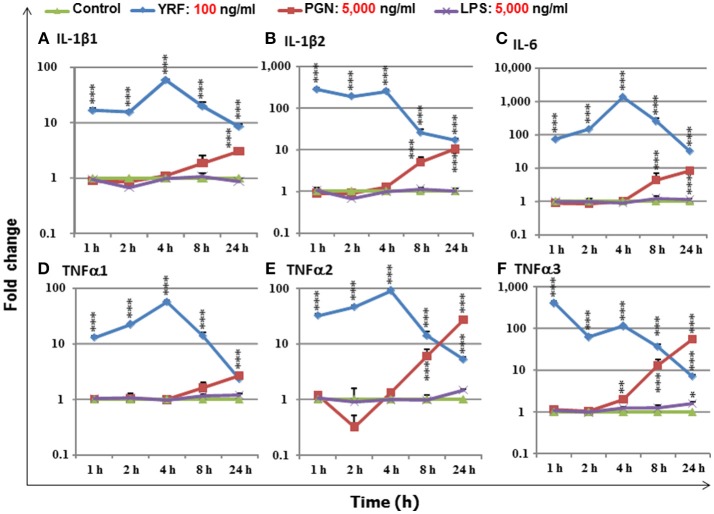
Figure 1.
The expression of IL-1β1 (A), IL-1β2 (B), IL-6 (C), TNFα1 (D), TNFα2 (E), and TNFα3 (F), in response to stimulation by YRF, LPS and PGN in RTS-11 cells. RTS-11 cells were stimulated with 100 ng/ml of YRF, 5,000 ng/ml of ultrapure LPS or 5,000 ng/ml of PGN for 1, 2, 4, 8, and 24 h. The expression levels were quantified by RT-qPCR and expressed as a fold change that was calculated as the average expression level of stimulated samples divided by that of the time-matched controls. The results are presented as the average + SEM from four wells of cells. Differences between stimulated samples and controls were tested by One way-ANOVA followed by the Bonferroni post hoc test. *p < 0.05, **p < 0.01, and ***p < 0.001.

