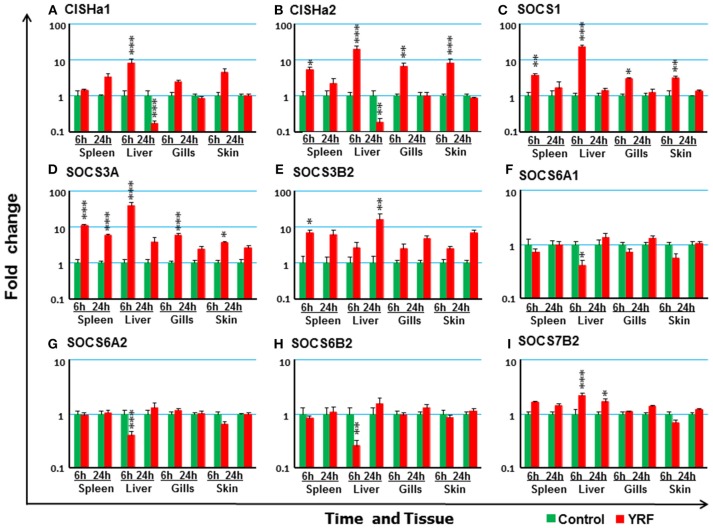
Figure 7.
The modulation of the expression of SOCS genes in vivo by YRF. Rainbow trout were ip injected with YRF or PBS, sampled and analyzed as described in Figure 2. The expression of CISHa1 (A), CISHa2 (B), SOCS1 (C), SOCS3A (D), SOCS3B2 (E), SOCS6A1 (F) SOCS6A2 (G) SOCS6B2 (H) SOCS7B2 (I) was examined. A fold change was calculated as the average expression level of YRF injected fish divided by that of time matched controls. The means + SEM of six fish are shown. Significant differences between injected fish and controls were tested by one way-ANOVA followed by the Bonferroni post hoc test, and are shown over the bars as; *p < 0.05, **p < 0.01, and ***p < 0.001.

