
FIGURE 10.
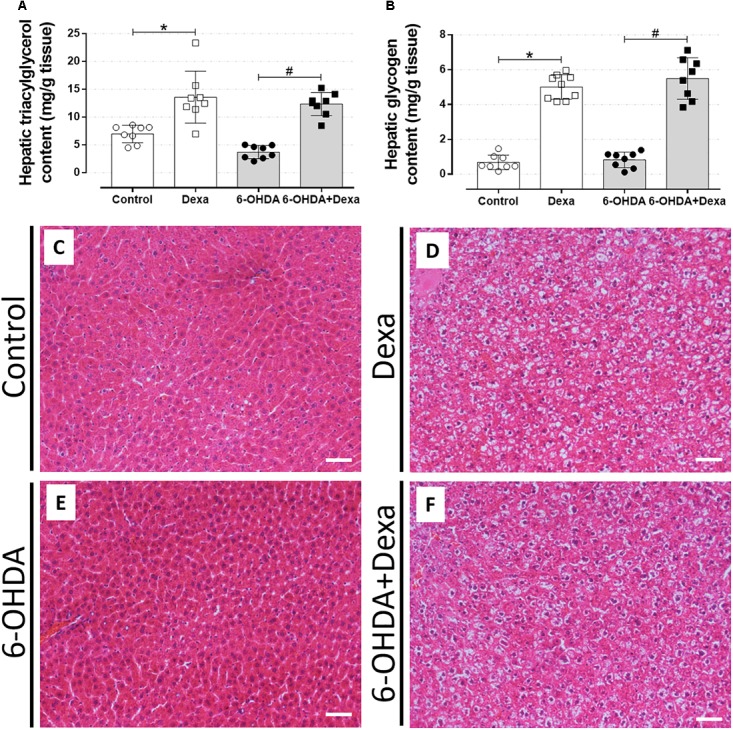
Liver parameters. (A) Hepatic triacylglycerol and (B) glycogen content at the day of euthanasia on the 38th day of the experimental protocol. Data are mean ± SD. ∗ and # indicate a significant difference compared to the respective Control and 6-OHDA groups using ordinary two-way ANOVA with Tukey’s post hoc test. n = 8–9, p < 0.05. (C–F) Representative liver sections from all groups in 200x magnitude stained with Hematoxylin and Eosin. n = 8–9. Scale bar in (C–F) represents 25 μm.