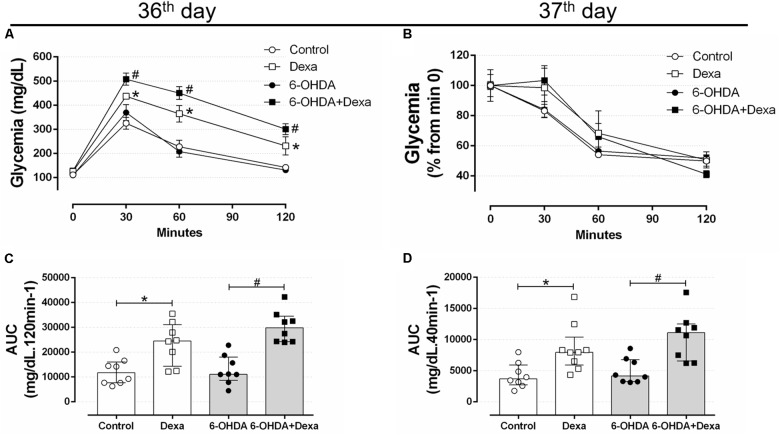
FIGURE 8.
Blood glucose values during the intraperitoneal glucose and insulin tolerance test on the 36th and 37th day of the experimental protocol. (A) Blood glucose values during the ipGTT on the 36th day. (B) Blood glucose values (normalized from min 0) during the ipITT on the 37th day. (C) Area-under-curve during ipGTT and (D) during ipITT. Data are mean ± SEM in (A,B) (SEM were applied only for aesthetic reasons), and median and interquartile range as they are asymmetrically distributed (nonparametric) in (C,D). ∗ and # Indicates a significant difference compared to the Control and 6-OHDA groups, respectively, using ordinary two-way ANOVA with repeated measures in (A,B), or Kruskal–Wallis with Dunn’s post hoc test in (C,D). n = 8–9, p < 0.05.

