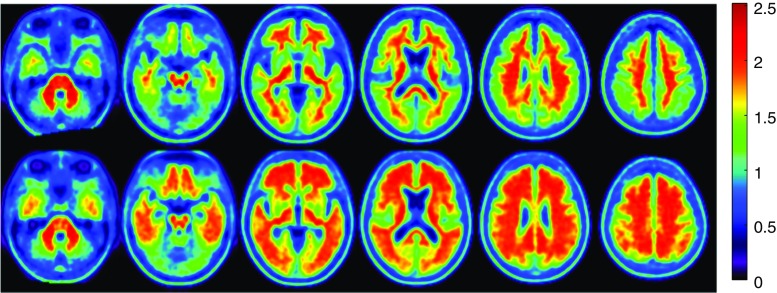
Fig. 1.
Axial view of [18F]Florbetaben PET amyloid load in mild cognitive impairment. Average axial slices of mild cognitive impairment subjects with low (Aß-; top panel) and high amyloid load (Aß+; bottom panel). Subjects were classified using k-means clustering. Signal intensity is significantly lower in the grey matter regions of the top images compared to those of the bottom images (P < 0.0001)

