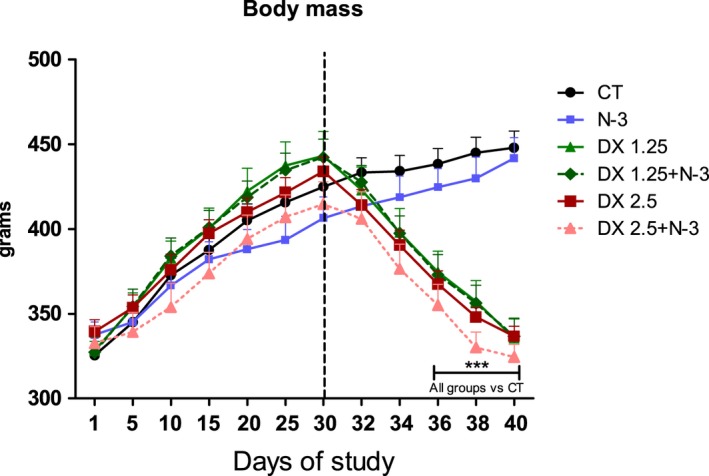
Figure 1.

Body mass during the 40 days of the study. The dotted line represents the initial moment of DEXA administration. Data are presented as mean ± SD. Asterisks represent the statistical analysis in comparison to the CT; ***P < 0.001 (n per group: CT = 10, N3 = 10, DX1.25 = 9, DX1.25+N3 = 8, DX2.5 = 8, DX2.5+N3 = 9). A repeated‐measures ANOVA followed by Bonferroni post hoc test was used.
