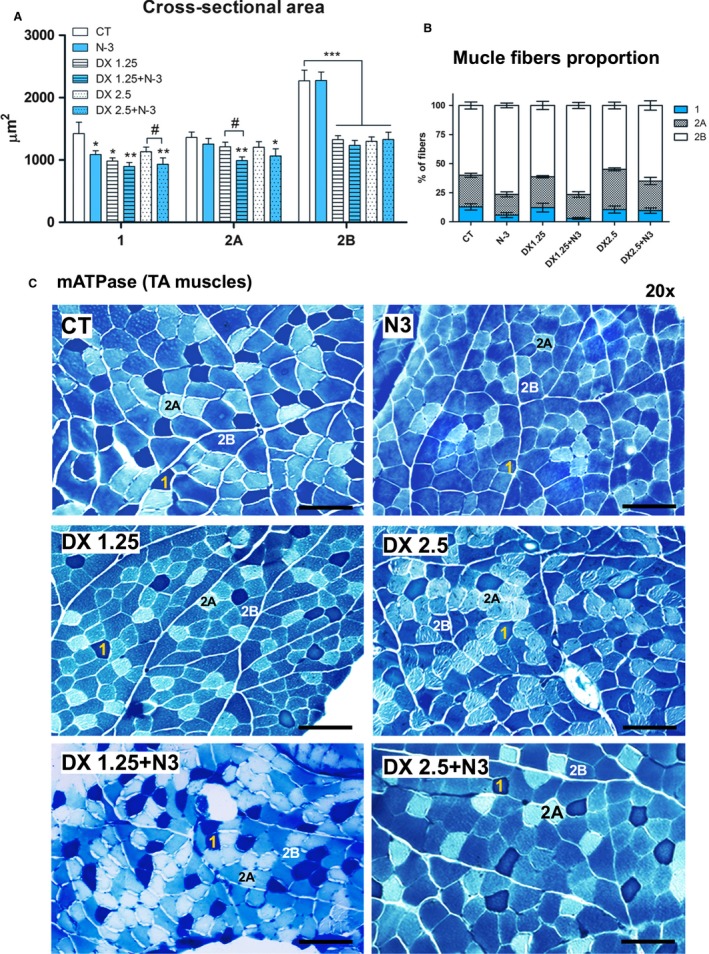
Figure 2.

Muscle cross‐sectional area and muscle fiber type proportions analyzed after 40 days of N‐3 supplementation associated or not with dexamethasone on the last 10 days. (A) Cross‐sectional area – (*) represents statistical analysis in comparison to the control group (CT), and (#) represents differences between two groups. Legend: * or # = P < 0.05; **=P < 0.01 and ***=P < 0.001 (n per group: CT = 9, N3 = 9, DX1.25 = 9, DX1.25+N3 = 8, DX2.5 = 8, DX2.5+N3 = 7). One‐way ANOVA followed by Bonferroni post hoc test was used for each fiber type analysis; (B) muscle fiber type proportions. Statistical analysis is expressed in Table 2; (C) histological mATPase photographs from all groups.
