
Figure 8.
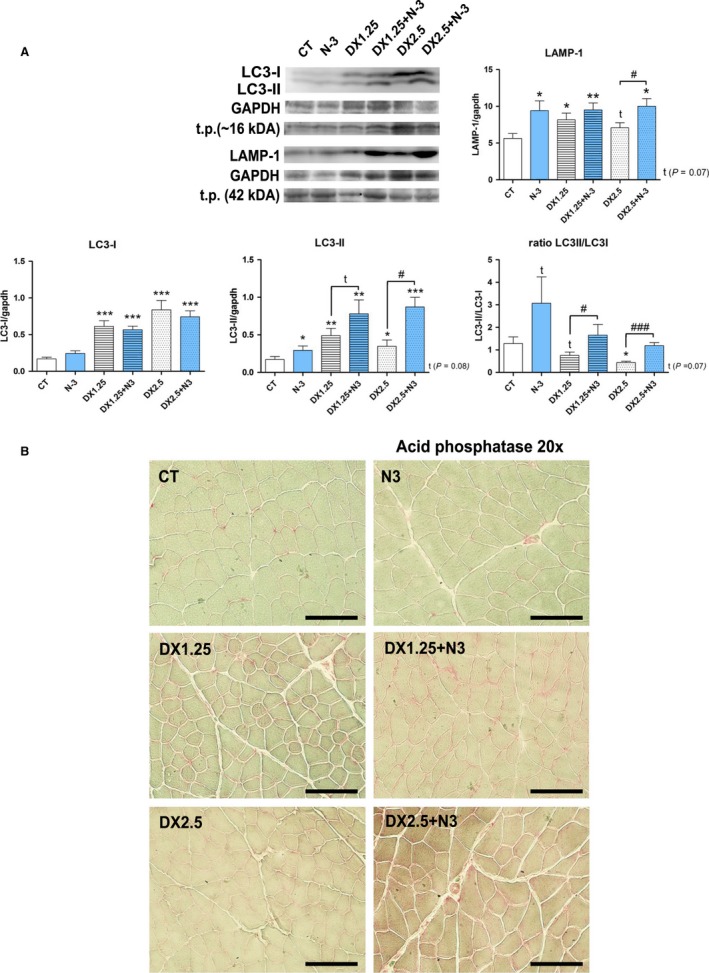
LC3I, LC3II, LC3I/LC3II ratio and LAMP‐1 expressions after 40 days of N‐3 supplementation associated or not with dexamethasone on the last 10 days. (A) Western blotting analysis; (B) Qualitative acid phosphatase reaction in TA muscle slides of all groups; (*) represents the statistical analysis in comparison to the CT, and (#) represents differences between groups. Student's t‐test was used; Legend: * or #P < 0.05; ** or ##P < 0.01 and *** or ###P < 0.001; Legend: t.p. = total protein; (n per group: CT = 10, N3 = 10, DX1.25 = 8, DX1.25+N3 = 7, DX2.5 = 7, DX2.5+N3 = 9).