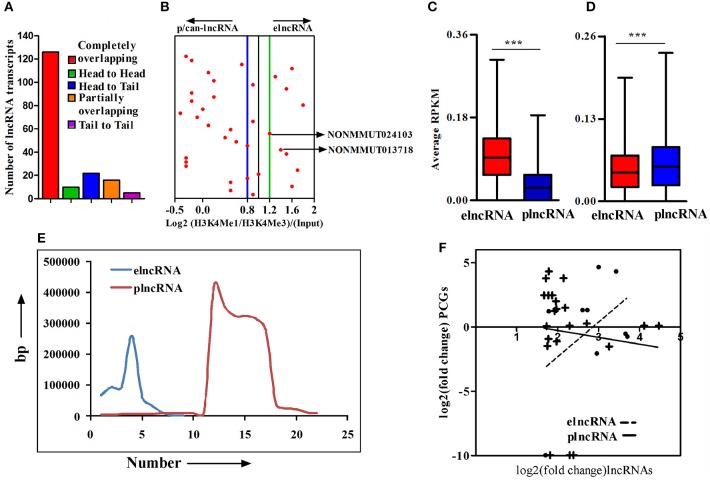
Figure 3.
Cataloging of up-regulated lncRNA transcripts based on chromatin signatures. (A) cataloging of up-regulated lncRNA transcripts based on their orientation with respect to nearby PCGs; (B) Representative plot showing log2 ratio of chromatin signatures H3K4Me1 and H3K4Me3 (after normalization with input) around 4 window of transcription start site (TSS) of lncRNAs; (C) Average normalized RPKM (reads per kilobase million) values of H3K4Me1 in elncRNAs and plncRNAs; (D) Average normalized RPKM (reads per kilobase million) values of H3K4Me3 in elncRNAs and plncRNAs; (E) Distribution of distances of elncRNAs and plncRNAs from their respective nearby genes; and (F) Correlation between fold changes of elncRNAs and plncRNAs and their closest protein coding genes (PCGs), respectively. The linear regression curves of the best fit are shown as dotted line for elncRNA and solid line for plncRNA. ***P ≤ 0.001.

