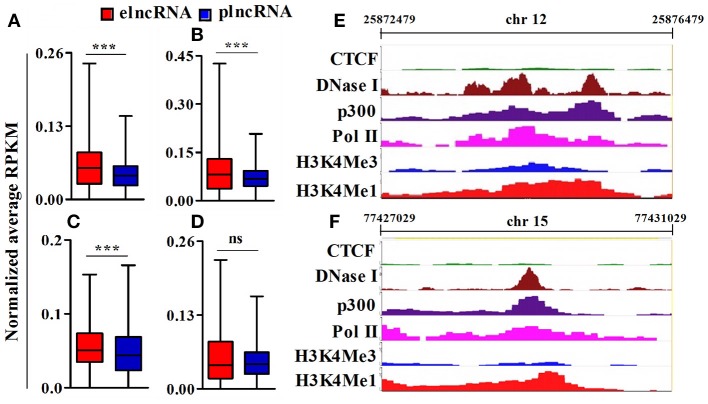
Figure 4.
Analysis of epigenomic signatures around transcription start site (TSS) of elncRNAs and plncRNAs. (A–D) Average normalized RPKM (reads per kilobase million) values of RNA polII, p300, DNaseI hypersensitivity site, and CCCTC binding factor (CTCF) in elncRNAs and plncRNAs, respectively; (E,F) Contrast chromatin (H3K4Me1 and H3K4Me3) and epigenetic (RNA polII, p300, DNaseI hypersensitivity and CTCF binding site) landscapes (in mouse lungs) around TSS of NONMMUT013718 and NONMMUT024103 elncRNAs, respectively. ***P ≤ 0.001 and ns = non-significant.

