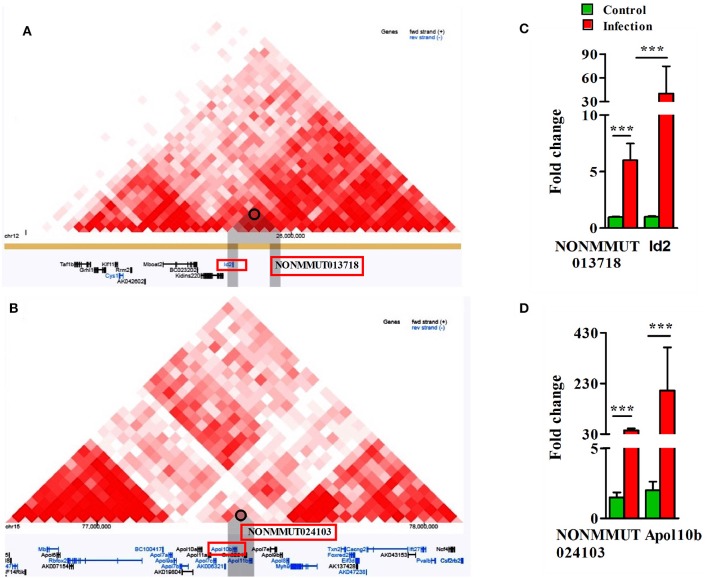
Figure 5.
Analysis of Hi-C interaction and qPCR. (A) The triangle heatmap of Hi-C tracks of NONMMUT013718 elncRNA and its proximal PCG ID2 and their interacting loci; (B) The triangle heatmap of Hi-C tracks of NONMMUT024103 elncRNA and its proximal PCG Apol10b and their interacting loci; (C,D) Expression of NONMMUT013718 and NONMMUT024103 elncRNA and their respective target genes ID2 and ApoL10b in infected mouse lungs (n = 4). The error bars represents standard error of mean (SEM) and the levels of significance are shown as ***P ≤ 0.001.

