Fig. 5.
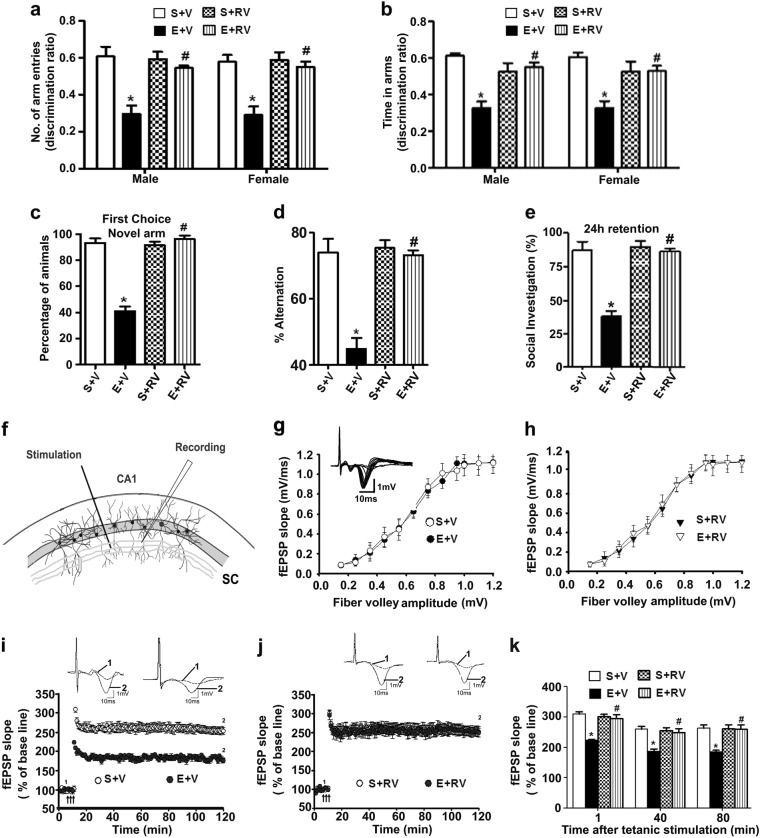
Pretreatment of P7 mice with RV rescues behavioral and synaptic plasticity abnormalities found in adult mice exposed to postnatal ethanol. The spatial working memory was determined with the Y-maze in adult male and female mice treated with saline (S+V) or ethanol (E+V) with or without RV (S+RV and E+RV) at the P7 developmental stage. The discrimination ratio [preference for the novel arm over the familiar other arm (Novel/Novel+Other)] for arm entries (a) and dwell time (time spent in each arm) (b) of the S+V-, E+V-, S+RV-, and E+RV-administered mice 24 h after the first encounter with the partially opened maze. The percentage of mice choosing the novel arm as the first choice is shown for S+V-, E+V-, S+RV-, and E+RV-administered mice, 24 h after the first encounter with the partially opened maze (c). The spontaneous alternation memory of adult mice treated with S+V, E+V, S+RV, and E+RV at P7 was determined using the Y-maze. The percentage of spontaneous alternation performance by mice is shown for all the treatment groups (d). The percentage of social investigation is shown for all the treated mice (S+V, E+V, S+RV, and E+RV), 24 h after the first encounter with the same juvenile mouse. (*p < 0.05 vs. saline; #p < 0.05 vs. ethanol, n = 8 mice/group) (e). A schematic illustration demonstrates the position of the stimulating and recording electrode in the CA1 region of the hippocampus (f). The average fEPSP slope at various time points of P7 S+V-, E+V-, S+RV-, or E+RV-treated adult male mice is shown (g, h). Inset: Representative traces are shown for the saline group. For each slice, the fEPSP slopes were normalized against the average slope over the 10-min recording before LTP stimulation. Arrows show the time of TBS (4 pulses at 100 Hz, with bursts repeated at 5 Hz, and each tetanus including 3 different 10-burst trains separated by 15 s) (i, j). Inset: Representative traces before and after TBS are shown for all the treatment groups. Scale: 1 mV; 10 ms. Bar graph demonstrates the average of the fEPSP slopes at multiple time points after TBS for all the treated groups (k) (*p < 0.05 vs. S; #p < 0.05 vs. E). Error bars, SEM (n = 5 mice/group; 10 slices/group)

