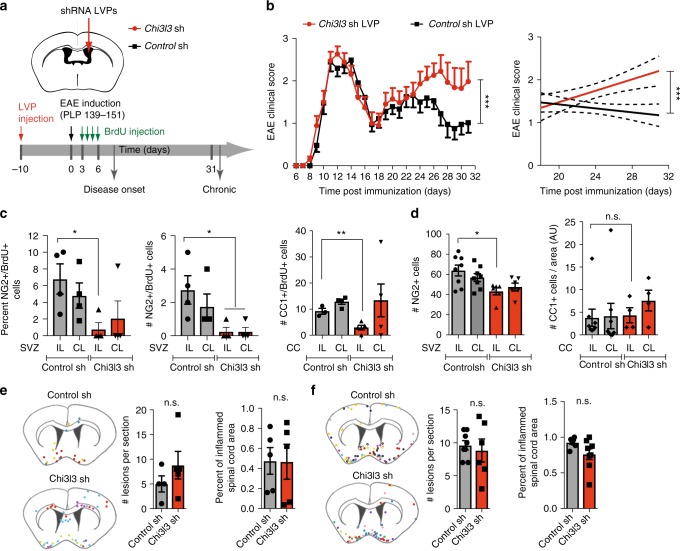
Fig. 6.
Subventricular zone-derived Chi3l3 affects EAE severity and oligodendrogenesis. a Protocol of shRNA lentiviral particle (LVP) administration, BrdU injection, and EAE induction. b Clinical score (left) and linear regression curves (right) of mice treated with control shRNA LVPs (black line) or Chi3l3 shRNA LVPs (red line) and immunized with PLP139–151. Dashed lines indicate 95% confidence intervals. (n = 23 control shRNA LVP and 27 Chi3l3 shRNA LVP mice per group; two-way ANOVA; c Quantifications of percentage (left) and number (right) of NG2+/BrdU+ double-positive cells in the ipsilateral (IL) and contralateral (CL) SVZ of Chi3l3 shLVP and control shLVP mice killed at onset of disease in vivo. (n = 4 per group; two-tailed Student’s t test; d Quantifications of and number of NG2+ cells in the ipsilateral (IL) and contralateral (CL) SVZ of Chi3l3 shLVP and control shLVP mice sacrificed during chronic EAE (n = 8 control shRNA mice, n = 6 Chi3l3 shRNA mice; two-tailed Student’s t test. e, f Localization (left) and quantification of inflammatory lesions in brain sections (middle) and spinal cord sections (right) of Chi3l3 shLVP and control shLVP mice killed at EAE onset (e; n = 4 mice control shRNA, n = 5 mice Chi3l3 shRNA (left, brain), n = 5 mice per group (right, spinal cord; two-tailed Student’s t-test; mean ± s.e.m) and during chronic EAE (f, n = 7 mice control shRNA mice, n = 8 Chi3l3 shRNA mice (left, brain) and n = 8 mice control shRNA mice, n = 6 Chi3l3 shRNA mice (right, spinal cord); two-tailed Student’s t test). Schematic diagram showing localization of inflammatory lesions of individual mice, each color represents an individual mouse. (mean ± s.e.m.; *p < 0.05; **p < 0.01; ***p < 0.005)

