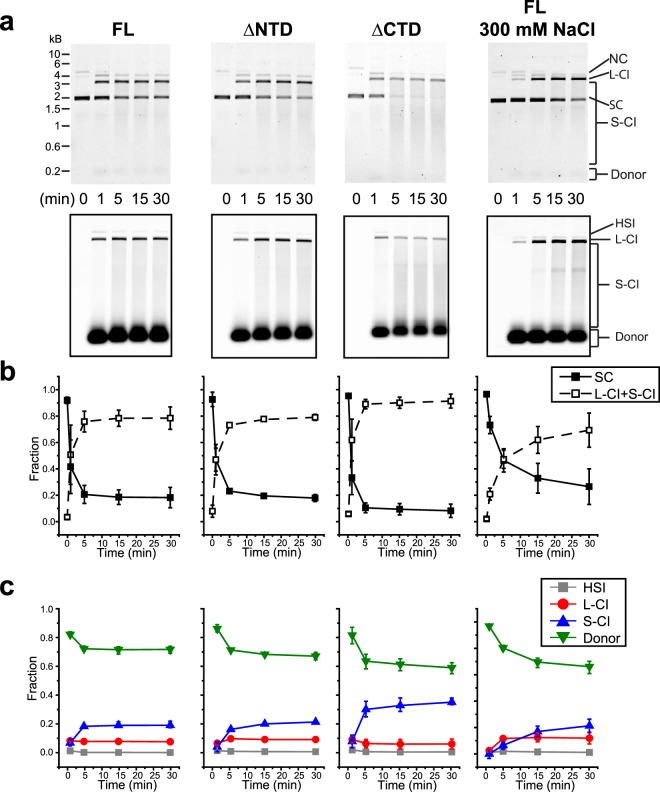
Figure 2.
Time courses of integration by FL and truncation mutant PFV intasomes. PFV intasomes, including FL, ∆NTD, and ∆CTD, with Cy5 fluorescently labeled viral DNA were assayed for integration to a supercoiled plasmid over time. PFV FL intasomes were also assayed in the presence of 300 mM NaCl. (a) Integration products were separated by agarose gel electrophoresis and imaged for ethidium bromide (top panels) and Cy5 (bottom panels) fluorescence. (b) The ethidium bromide intensity of supercoiled plasmid is shown as the fraction of signal within each lane. The fraction of signal that is CI is the sum of the intensities of the linear band, the smear between linear and supercoiled bands, and the smear below the supercoiled band. (c) The relative Cy5 intensity within each lane is shown for the viral donor band, the linear CI product band, the HSI nicked circle band, and the smear of concerted integration products between the linear band and the viral donor. Experiments were performed at least three times with at least two independent intasome preparations. Error bars indicate standard deviation. NC, nicked circle. L-CI, linear CI products. SC, supercoiled plasmid. S-CI, smear CI products. Donor, viral donor DNA.

