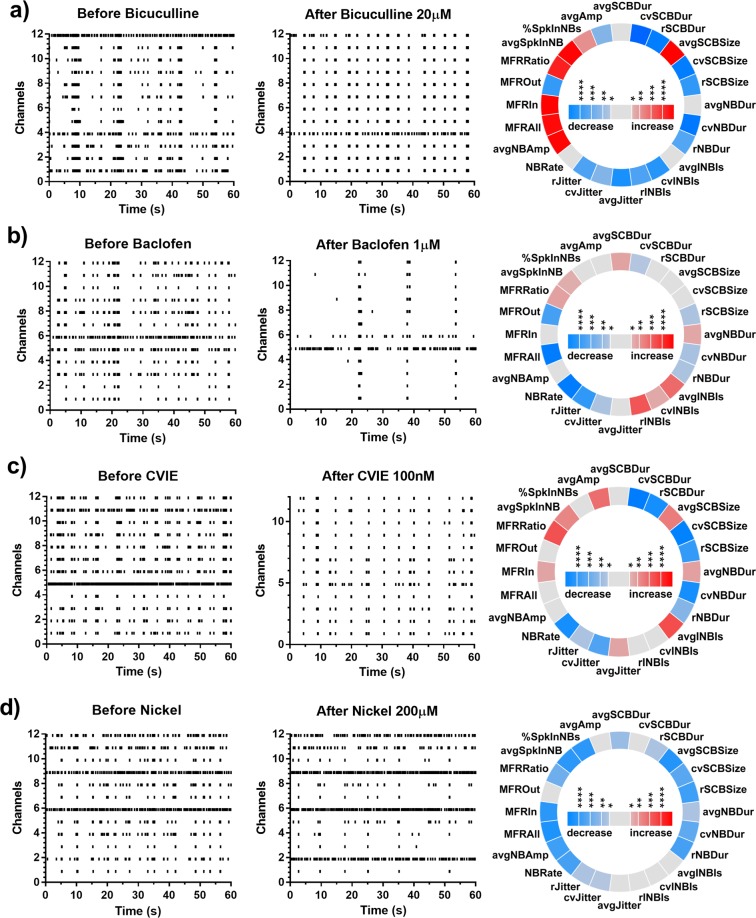
Figure 3.
Changes in network behaviour evoked by drugs used for comparison. (a) 20 µM bicuculline, (b) 1 µM baclofen and (c) 200 µM Nickel (d) 100 nM CVIE. In each sub plot, representative raster plots of baseline activity of a culture, the activity after drug application and an iris plot showing the statistically significant changes in network features are shown. In the iris plot, each segment in the circle represents one feature. The colour scales represent the significance of p values (*p < 0.05, **p < 0.01, ***p < 0.001, ****p < 0.0001) resulting from paired t-tests.

