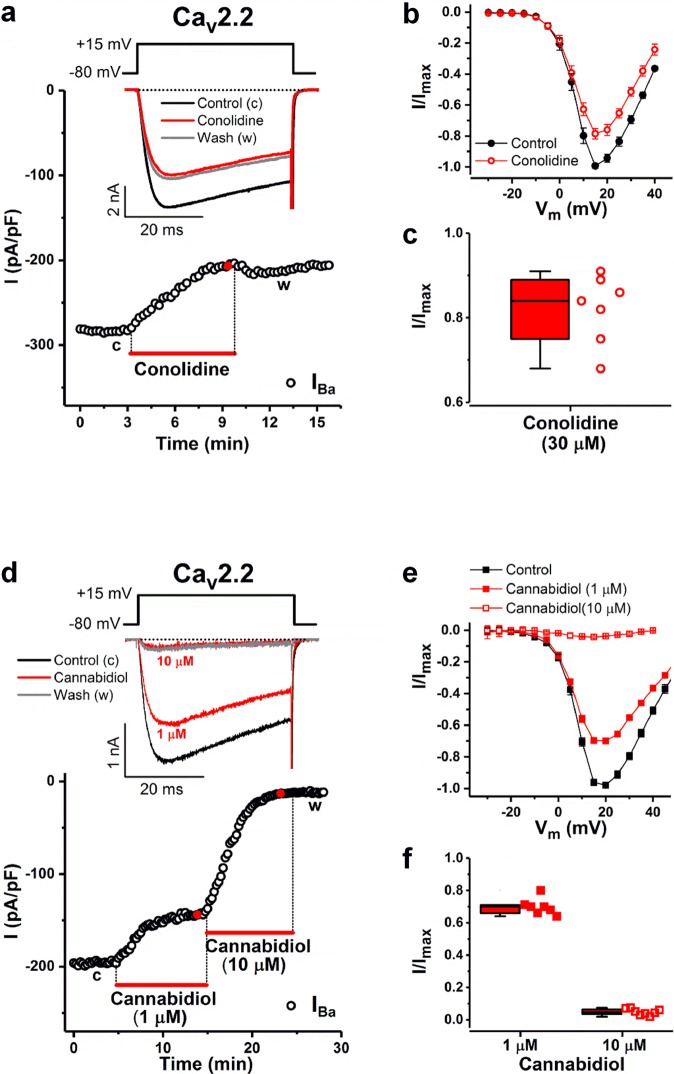
Figure 6.
Conolidine and cannabidiol inhibition of currents through transiently expressed human Cav2.2 channels. (a) Time course of IBa in the absence (control) and presence of 30 μM conolidine. Bar indicates conolidine application. IBa was evoked by 40-ms depolarizations to +15 mV, applied every 15 s from a holding potential of −80 mV (voltage inset). Representative inset IBa traces in the absence and presence of conolidine are shown at the times indicated by lowercase letters and the red filled circle, respectively. Horizontal dotted line represents zero-current level. (b) Mean current-voltage (I-V) relationships in the absence (control) and presence of conolidine (30 μM). (c) Summary of IBa inhibition by conolidine. The whisker box plot displays the median and the lower and upper quartiles; whiskers represent the minimum and maximum of the data (n = 7). (d) Time course of peak IBa in the absence and presence of 1 μM and 10 μM cannabidiol (lowercase letters and red filled circles, respectively). Data presentation and voltage protocol similar to that shown in a. (e) Mean I-V relationships in the absence (control) and presence of cannabidiol. (f) Summary of IBa inhibition by 1 μM and 10 μM cannabidiol (n = 7 and 8, respectively).

