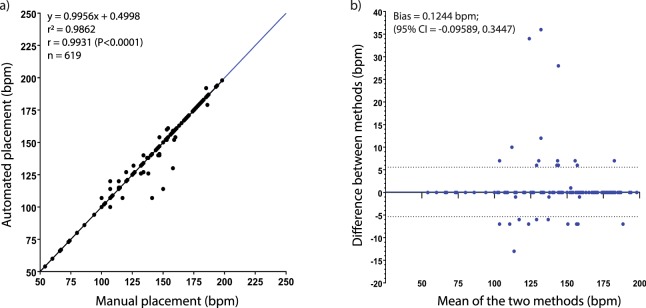
Figure 3.
A comparison of heart rates derived from automated placement of Region of Interest match those derived via manual placement. (a) Heart rate data from both ROI placement methods were plotted against one another and linear regression derived r2, slope and p-value. r value indicates correlation of manual and automatic placement of ROI-derived data of all imaged animals across 10 total experiments. The line of identity (blue) illustrates a hypothetically “perfect” correlation between the two data sets for comparison. (b) A Bland-Altman analysis provides quantitative data on the disagreement between the two methods (bias) and the interval within which 95% of all disagreement occurs (95% limits of agreement indicated by dashed lines; −5.346 to 5.594). The x-axis is the average between the heart rates derived from the two methods, and the y-axis is the distance that those two values are from one another (Method A-Method B). A positive value on the y-axis indicates that Method A (manual ROI placement) returned a higher value, and vice versa.

