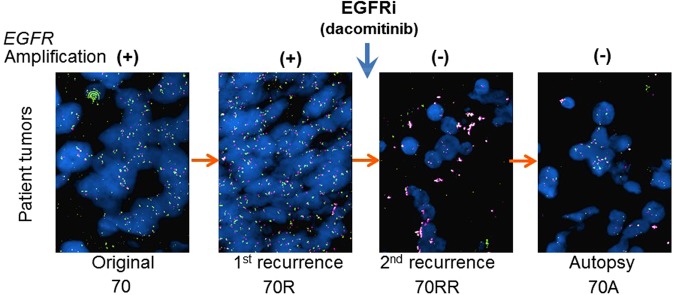
Figure 3.
EGFR inhibition resulted in elimination of EGFR-amplified populations. FISH images of the patient tumours, with EGFR probe in green and centromere 7 (CEN7) control probe in red. From left to right, panel represents the original tumour MGG70 (70), the first recurrent tumour before dacomitinib treatment MGG70R (70R), the re-recurrent tumour after dacomitinib treatment MGG70RR (70RR) and the autopsy material MGG70A (70A). Clumped amplification of EGFR is noted in 70 and 70 R, but not in 70RR and 70 A.

