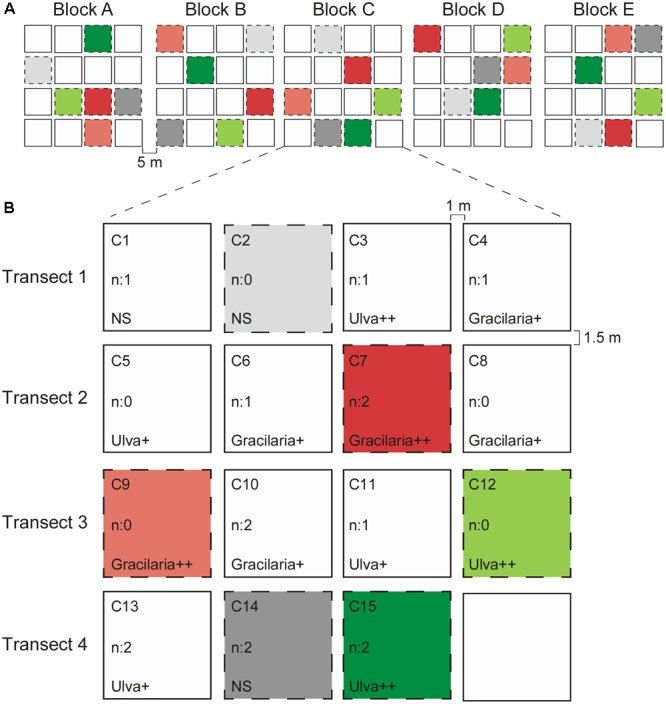
FIGURE 1.

Experimental design. (A). Five blocks along a transect with 5 m in between the blocks. (B) Example of one of the blocks showing all the different treatment plots. Between two plots within a transect there is a distance of 1 m and the distance between two plots of adjacent transects is 1.5 m. The different treatments considered in this study are colored and are as follow: Light gray: n: 0 = no nutrients, NS = no seaweeds; Dark gray: n: 2 = 250 g N m-2 of nutrients added; Light red: n: 0 = no nutrients, Gracilaria++ = 3000 g WW m-2 of Gracilaria added; Dark red: n: 2 = 250 g N m-2 of nutrients added, Gracilaria++ = 3000 g WW m-2 of Gracilaria added; Light green: n: 0 = no nutrients, Ulva++ = 3000 g WW of Ulva m-2 added; Dark green: n: 2 = 250 g N m-2 of nutrients added, Ulva++ = 3000 g WW of Ulva m-2 added. Each block was composed by the same treatments and each one was sampled for each treatment totalling five replicates/treatment. No colored plots were not considered in this study.
