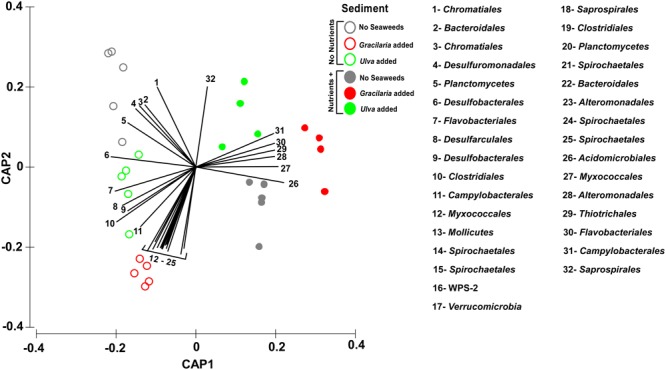
FIGURE 3.

Canonical analysis of principal coordinates (CAP) ordination plot (based on Bray–Curtis of square-root transformed bacterial abundances) showing canonical axes that best discriminate the bacterial community assemblages across nutrient (open vs. closed circles) and seaweed addition (grey – no seaweeds, red – Gracilaria, green – Ulva). Order level OTUs with Pearson’s correlation >0.70 have been overlaid on the plot as vectors. Vector length corresponds to the strength of the correlation, with the circle representing the maximum correlation of 1. Image was manipulated by replacing the taxa names by numbers (with correspondence in lateral legend), in order to improve visualization. In addition, colors were changed so different treatment colors would match those of Figure 1.
