FIGURE 6.

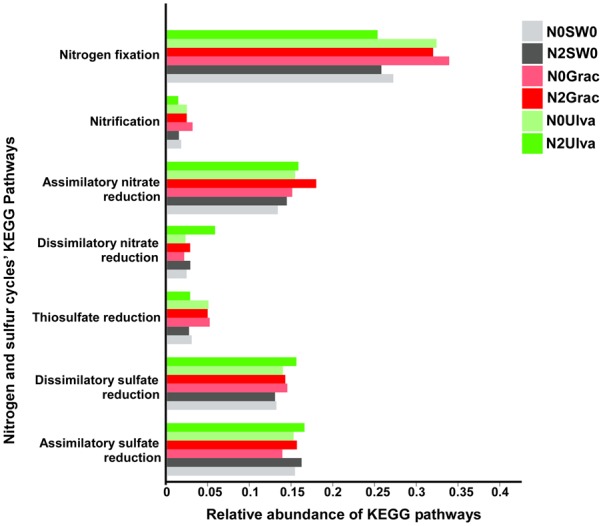
Relative abundance of nitrogen and sulfur cycles KEGG pathways for each treatment (with samples from the same treatment pooled together). Graphic colors were changed so different treatment colors would match those of Figure 1.

Relative abundance of nitrogen and sulfur cycles KEGG pathways for each treatment (with samples from the same treatment pooled together). Graphic colors were changed so different treatment colors would match those of Figure 1.