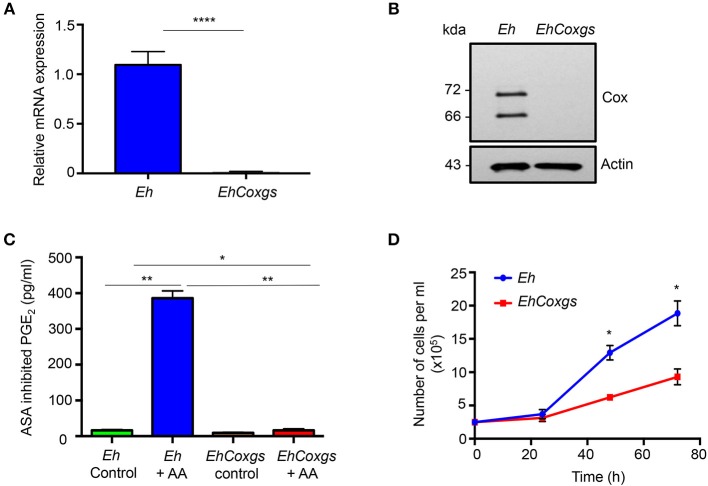
Figure 1.
Silencing of the Cox-like protein in E. histolytica. (A) qPCR was used to monitor cox expression using cDNA from E. histolytica. The data indicate the changes in mRNA expression compared with controls. (B) Immunoblot blot analysis was performed on lysate prepared from control Eh and EhCoxgs. The proteins were separated on 8% SDS PAGE gels and analyzed with a polyclonal cox antibody or actin antibody. (C) PGE2 production was quantified using enzyme-linked immunosorbent assay kits following treatment of EhNP with or without AA or aspirin (ASA) for 1 h at 37°C. The bars indicate the means and the error bars indicate the standard errors of the means for three different experiments. (D) Approximately 2.5 × 10⁵ control Eh and EhCoxgs in the logarithmic growth phase were inoculated into 14 mL fresh culture medium and Eh were counted every 24 h. Data shown are the means and the error bars indicate the standard errors of the means for three different experiments. The asterisks indicate the results of comparisons with the controls. *P < 0.05, **P < 0.01, ****P < 0.001. Eh, E. histolytica.

