Figure 2.
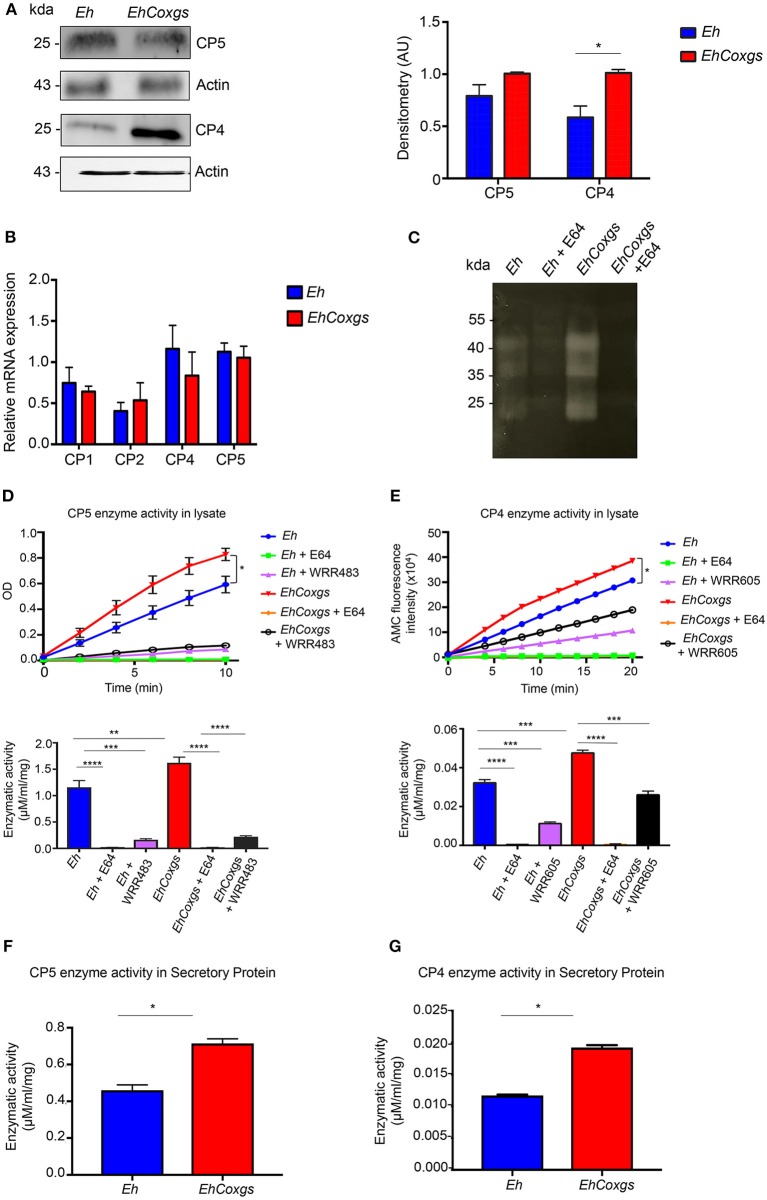
Gene silencing of EhCox increases cysteine protease expression and activity. (A) Immunoblot blot analysis was performed on lysate prepared from control Eh and EhCoxgs. The proteins were separated on 12% SDS PAGE gels and analyzed with CP5, CP4 or actin antibody. Quantifications of CP5/4 were performed by densitometric analysis from three independent experiments shown in right panel. (B) qPCR was used to monitor CPs expression using cDNA from Eh and EhCoxgs. Data indicate changes in mRNA expression compared with controls. (C) Gelatin substrate gel electrophoresis of lysate from control Eh and EhCoxgs treated/untreated with E64. (D,E) CPs enzymatic activity was evaluated by incubating inhibitor-treated/non-treated Eh with EhCP-A5 or EhCP-A4 substrates for 10 and 20 min, respectively and calculated in μM/min/mg, shown in the bottom panel. (D) EhCP-A5 enzymatic activity in lysate with known substrates (Z-RR) and 20 μM of inhibitor WRR483. (E) EhCP-A4 enzymatic activity in lysate with known substrates (Z-VVR) and 20 μM of inhibitor WRR605 and 100 μM E64. (F) EhCP-A5 and (G) EhCP-A4 enzymatic activity in secreted protein. The bars indicate the means and the error bars indicate the standard errors of the means for three different experiments. The asterisks indicate the results of comparisons with the controls. *P < 0.05, **P < 0.01, ***P < 0.002, ****P < 0.001.

