
Figure 1.
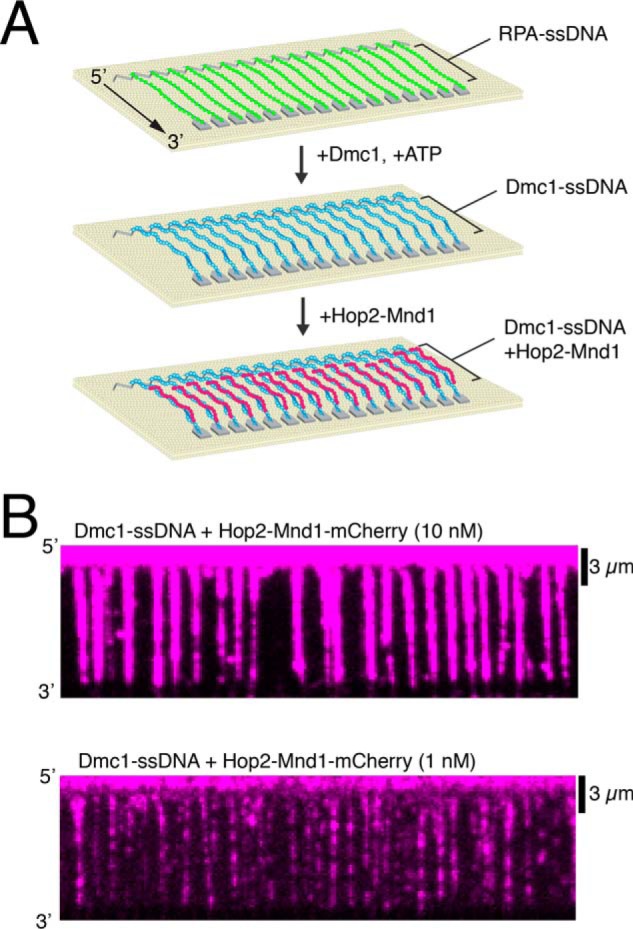
Using ssDNA curtains to measure the association of Hop2–Mnd1 with Dmc1–ssDNA filaments. A, schematic diagram of DNA curtains experiments that follows the assembly of Dmc1–ssDNA filaments from RPA-ssDNA, as described (27, 48), followed by the binding of Hop2–Mnd1–mCherry. B, wide-field TIRFM images of Dmc1–ssDNA curtains (unlabeled) bound with 10 nm (top) and 1 nm (bottom) Hop2–Mnd1–mCherry (magenta).