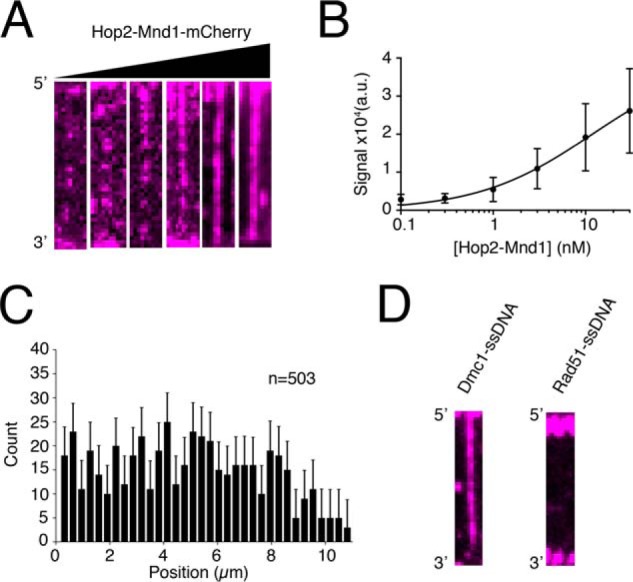
Figure 2.

Equilibrium binding properties and specificity of Hop2–Mnd1. A, wide-field TIRFM images of Dmc1–ssDNA filaments with 0.1, 0.3, 1.0, 3.0, 10, of 30 nm Hop2–Mnd1–mCherry (magenta), as indicated. B, quantification of integrated fluorescence signal intensity from Hop2–Mnd1–mCherry binding to Dmc1–ssDNA filaments. The graph was generated by measuring the integrated signal intensity (a.u., arbitrary units) for at least 30 ssDNA molecules at each titration point. The data were fit by a Hill equation, and the error bars represent S.D. of individual molecules. C, position distribution histogram of individual Hop2–Mnd1 molecules bound along Dmc1–ssDNA molecules (n = 503). Error bars were generated by bootstrapping the data using a custom Python script (48). D, wide-field TIRFM images of Dmc1–ssDNA molecules or Rad51-ssDNA molecules in the presence of 10 nm Hop2–Mnd1–mCherry (magenta).
