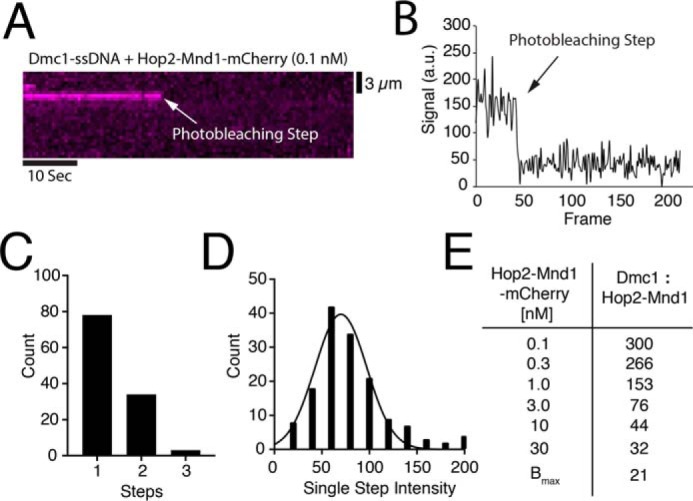
Figure 3.

Analysis of individual Hop2–Mnd1–mCherry binding events. A, representative kymograph of single Hop2–Mnd1-mCherry complex (magenta) bound to a Dmc1–ssDNA molecule and visualized with constant laser illumination. Abrupt loss of the signal reflects photobleaching of mCherry as highlighted by the white arrow. B, representative trace of the normalized signal intensity of an individual Hop2–Mnd1–mCherry molecule measured over time (a.u., arbitrary units). The photobleaching step is highlighted with an arrow. C, histogram representing the number of photobleaching steps observed for each observed foci of Hop2–Mnd1–mCherry (n = 115) bound to Dmc1–ssDNA. D, histogram showing the magnitude of the individual mCherry photobleaching steps (n = 155). The change in mean signal intensity during a photobleaching step was determined from a Gaussian fit to the data. E, table displaying estimates for ratio of Dmc1 to Hop2–Mnd1 at each concentration of Hop2–Mnd1–mCherry tested. The Bmax value was determined from the data presented in Fig. 2B and represents the saturation of the Dmc1–ssDNA filaments with Hop2–Mnd1–mCherry.
