Figure 4.

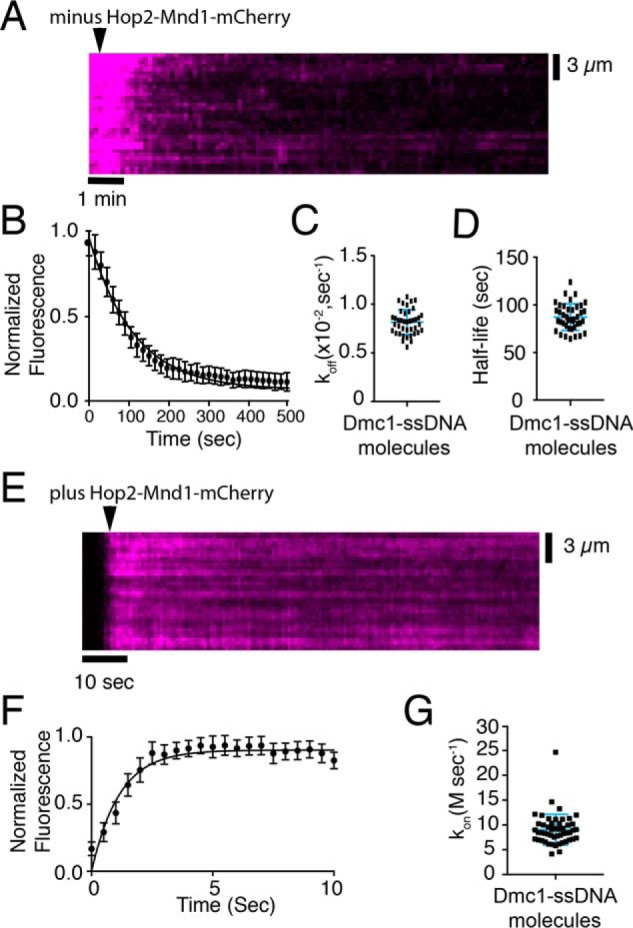
Hop2–Mnd1 dissociation and association kinetics. A, representative kymograph measuring Hop2–Mnd1 dissociation from Dmc1–ssDNA molecules. The arrowhead highlights the time point at which free Hop2–Mnd1–mCherry was flushed from the sample chamber, and the dissociation of Hop2–Mnd1–mCherry (magenta) is readily observed as the loss of mCherry signal. B, quantification of the normalized fluorescent intensities during dissociation of Hop2–Mnd1–mCherry from Dmc1–ssDNA. The graph represents the mean of all DNA molecules tested (n = 40), and the error bars are S.D. between individual molecules. C, measured dissociation rates (koff) of Hop2–Mnd1–mCherry for each individual Dmc1–ssDNA molecule tested (n = 40); error bars represent S.D. of the data. D, observed Hop2–Mnd1–mCherry half-lives for each individual Dmc1–ssDNA molecule that was measured. The half-life was determined from fitting the data with a single exponential decay function (n = 40). The error bars represent S.D. of the data. E, representative kymograph showing the association of Hop2–Mnd1–mCherry (magenta) with the Dmc1–ssDNA molecules (unlabeled). The arrowhead highlights the time point of the Hop2–Mnd1 injection. F, graph representing the normalized fluorescent intensity increase as Hop2–Mnd1–mCherry (10 nm) binds to Dmc1–ssDNA molecules. These data represent the mean for all molecules tested (n = 51); the solid line represents a fit to the binding data, and the error bars represent S.D. of all individual ssDNA molecules. G, association rates (kon) for each observed Dmc1–ssDNA molecule (n = 51). The error bars represent S.D. of the data.
