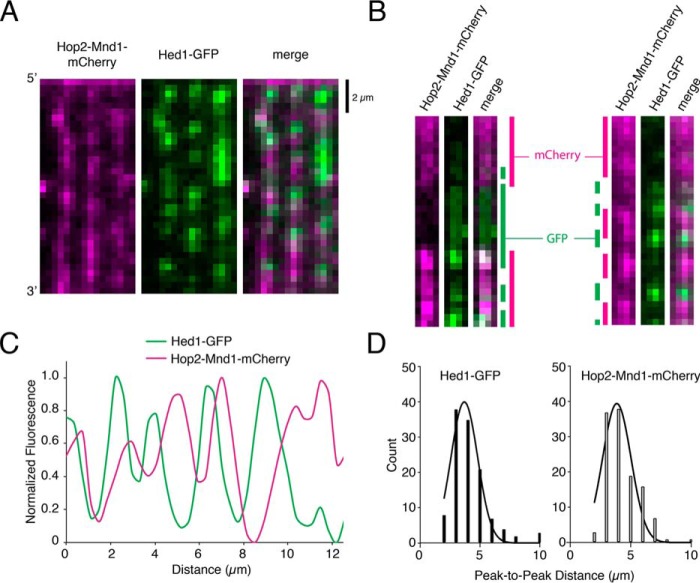
Figure 6.
Hop2–Mnd1–mCherry and Hed1–GFP bind to separate sections of the mixed recombinase filaments. A, wide-field image of recombinase ssDNA molecules prepared at a 1:1 ratio of Rad51 to Dmc1 and bound by both 30 nm Hop2–Mnd1–mCherry (magenta) and 30 nm Hed1–GFP (green). B, typical examples of single ssDNA molecules bound by 1:1 Rad51:Dmc1 filaments followed by the addition of Hop2–Mnd1–mCherry (magenta) and Hed1–GFP (green). In these examples, the locations of Hop2–Mnd1 and Hed1 are highlighted by color-coded bars shown at the sides of the images. C, a typical normalized fluorescent signal trace showing the spatial distributions of Hop2–Mnd1–mCherry and Hed1–GFP bound to an individual ssDNA molecule that was preassembled with a 1:1 ratio of Rad51 to Dmc1. D, histograms showing the peak-to-peak distances between either Hed1–GFP foci (left panel, n = 125) or Hop2–Mnd1–mCherry foci (right panel, n = 115) for ssDNA molecules (n = 125) bound by a 1:1 ratio of Rad51 to Dmc1. The mean distance between adjacent fluorescent foci bound to the same ssDNA molecules was determined from a Gaussian fit to the data.

